
Fig. 2.
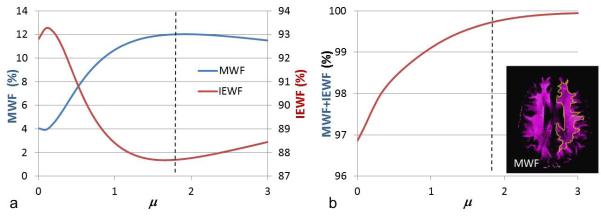
Effect of regularization coefficient μ on MWF and IEWF values in a healthy volunteer. (a) Averaged MWF and IEWF curves calculated in white matter ROI on the inset of the MWF map. (b) Summation of MWF and IEWF changed with μ. The vertical dashed lines are at μ =1.8. MWF represents myelin water fraction; IEWF represents intra- and extracellular water fraction.