
Fig. 6.
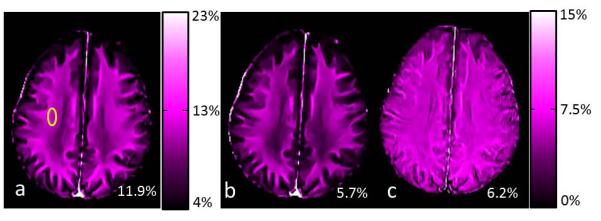
MWF maps generated from the modified (a) and conventional (b) CPMG sequences and the difference (c) between two maps. MWF values from the yellow ROI are shown in the lower right corner of each image.
Official websites use .gov
A
.gov website belongs to an official
government organization in the United States.
Secure .gov websites use HTTPS
A lock (
) or https:// means you've safely
connected to the .gov website. Share sensitive
information only on official, secure websites.
MWF maps generated from the modified (a) and conventional (b) CPMG sequences and the difference (c) between two maps. MWF values from the yellow ROI are shown in the lower right corner of each image.