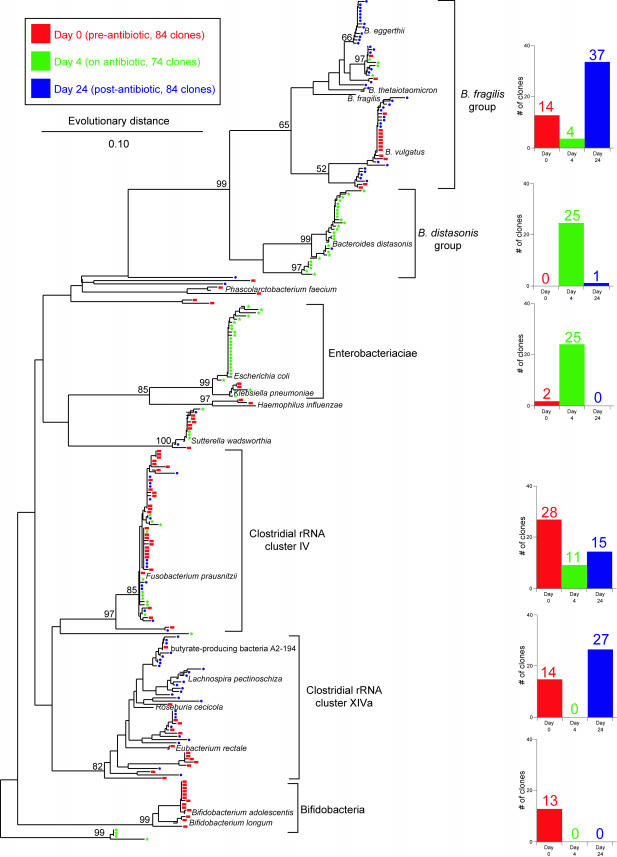
FIG.1.
Phylogenetic tree showing the distribution of 16S rDNA sequences of randomly selected clones from libraries constructed from stool DNA samples obtained from a patient prior to antibiotic therapy (day 0 [red]), during therapy (day 4 [green]), and 2 weeks after discontinuation of therapy (day 24 [blue]). Brackets outline major clusters of organisms, and the adjacent bar graphs document the distribution of clones in each cluster at each time point. Named species are representative type species downloaded from the Ribosomal Database Project and inserted into the tree to provide taxonomic reference points. These reference species do not contribute to the number of clones depicted in the bar graphs. The scale bar represents evolutionary distance (10 substitutions per 100 nucleotides). The tree was constructed using neighbor-joining analysis of a distance matrix obtained from a multiple-sequence alignment performed using the ARB suite of programs. Bootstrap values were calculated using the MEGA2 program.

