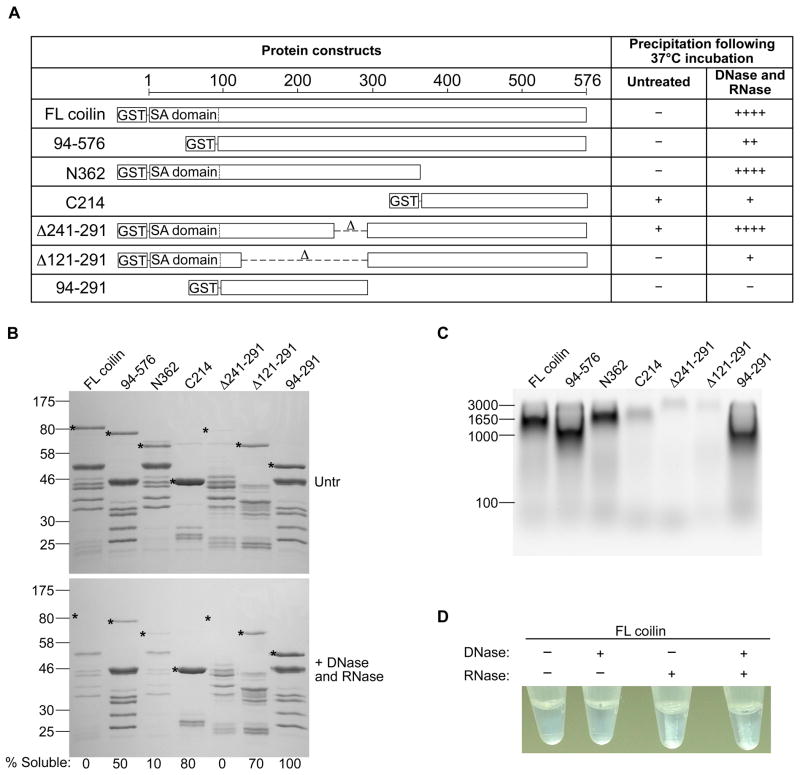
Figure 3.
(A) Diagrams of seven GST-tagged coilin constructs showing precipitation behavior of equal total protein, 160 μg, following incubation with or without DNase and RNase, with “-” being no visible precipitation and “++++” the most relative precipitate; SA = self-association, FL = full length. (B) Top panel, Coomassie stained SDS-PAGE gel of equal total partially purified GST-tagged proteins untreated; Bottom panel, equal volume of soluble protein following incubation with DNase and RNase; * indicates full length GST-tagged protein of interest for each construct; % Soluble value indicates the percentage of soluble protein remaining after nuclease treatment, relative to untreated soluble protein, as calculated by relative desitometric analysis of protein bands in top and bottom panels. (C) Equal amounts of total GST-tagged protein loaded into an agarose gel and stained with ethidium bromide to visualize relative amounts of co-purified nucleic acid. (D) Representative image of visible precipitate which forms upon nuclease treatment, seen with RNase treatment or the combination of DNase and RNase.

