
Figure 4.
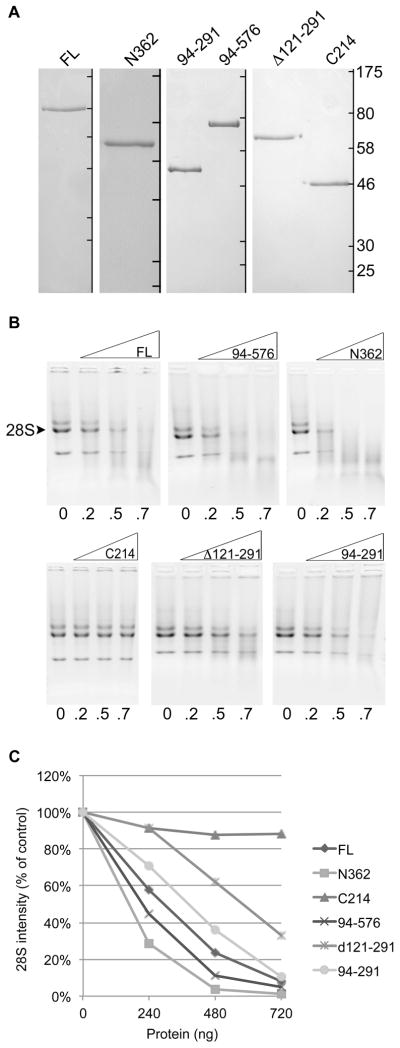
(A) Coomassie stained SDS-PAGE gels containing fully purified nucleic acid-free GST-tagged proteins; ladder to the right of each separate panel denotes marker locations of 175, 80, 58, 46, 30 and 25 kDa for each individual gel. (B) Agarose gels containing RNase assay results visualized by ethidium bromide; 500 ng RNA per lane; numbers beneath lanes indicate amount of protein in μg; the 28S rRNA band is indicated, with both the 32S and 18S also visible. (C) Line graph showing densitometric analysis of the 28S rRNA bands from images shown in B; percent band density of the control (no protein) band is plotted for each protein and amount.