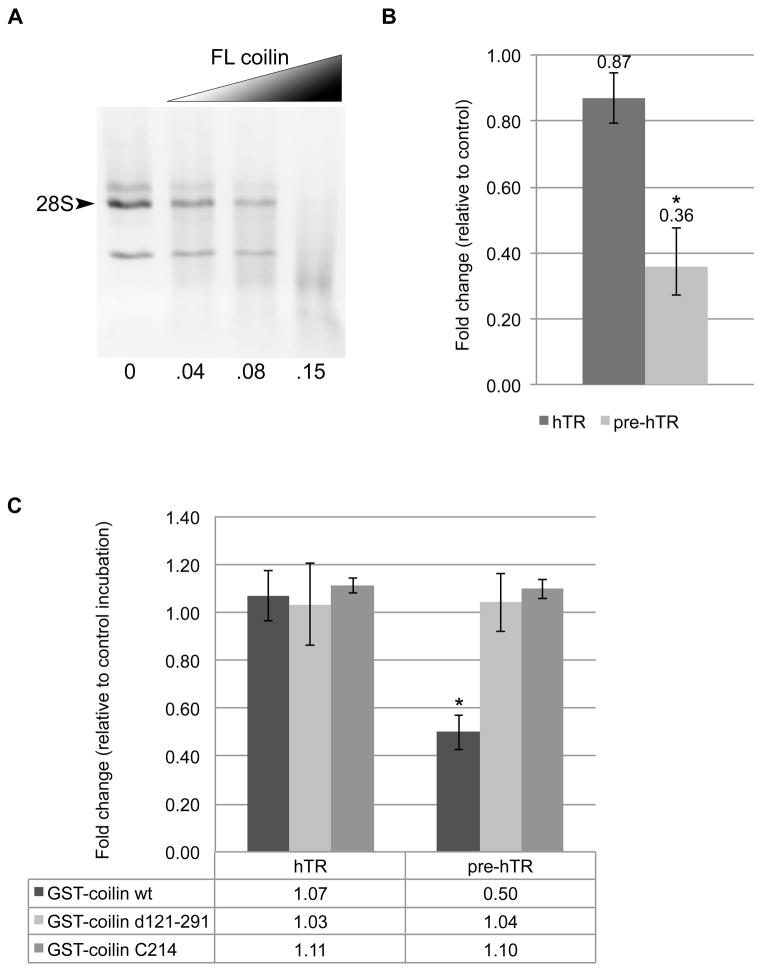
Figure 5.
(A) RNase activity of nucleic acid free purified coilin with 500 ng RNA; numbers beneath lanes indicate amount of protein in μg. (B) Histogram showing the fold change relative to control reactions of hTR and pre-hTR levels following incubation of HeLa RNA with nucleic acid free purified coilin; * indicates p<0.05 relative to the control incubation.(C) Histogram showing the fold change relative to control reactions of hTR and pre-hTR levels following incubation of HeLa RNA with nucleic acid free purified GST-tagged coilin proteins;* indicates p<2.0E-9 relative to GST-coilin d121-291 and GST-coilin C214. Error bars represent 1 s.d. for 3 experimental repeats with 3 technical repeats each.

