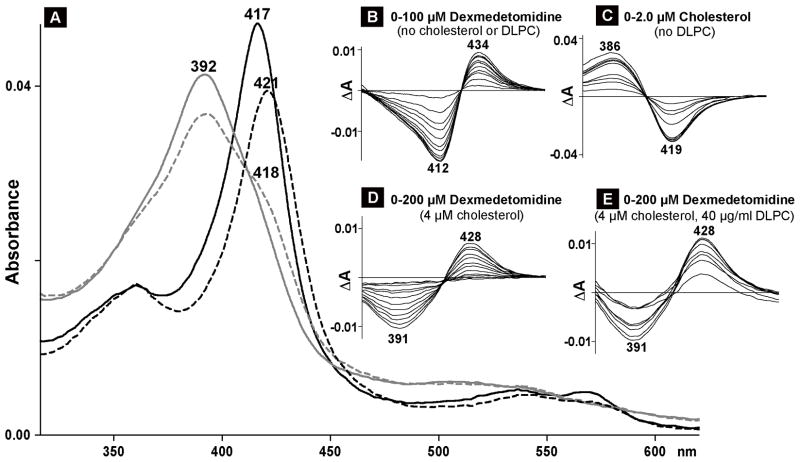
Fig. 4.
Spectral analysis of CYP11A interaction with dexmedetomidine. Numbers above or below the spectra indicate the wavelengths of absorption maxima or minima. A, absolute spectra; black and gray lines represent the spectra of cholesterol-free (black) and cholesterol-bound (gray) CYP11A1 in the absence (solid line) and presence (dashed line) of dexmedetomidine. The concentration of CYP11A1 was 0.4 μM; the concentrations of cholesterol and dexmedetomidine were 4 μM and 70 μM, respectively. These ligand concentrations are equal to 20 Kd of cholesterol (0.2 μM) and 10 Kd of dexmedetomidine (7.0 μM) for cholesterol-free CYP11A1. B–E, difference spectra of 0.4 μM CYP11A1 titrated under different assay conditions. B, titration with dexmedetomidine when no cholesterol or DLPC was added to the buffer (40 mM KPi, pH, 7.2, containing 1 mM EDTA). C, titration with cholesterol when no DLPC was added to the buffer. D, titration with dexmedetomidine in the presence of cholesterol when no DLPC was added to the buffer. E, titration with dexmedetomidine in the presence of cholesterol and DLPC.

