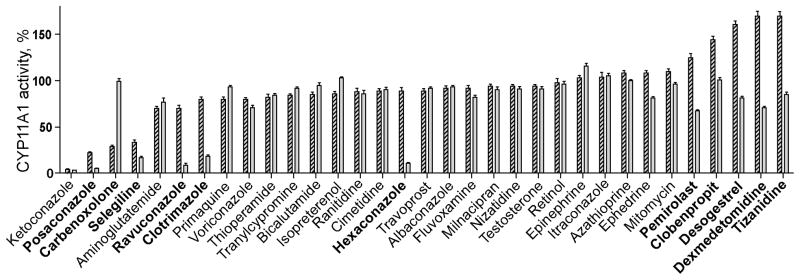
Fig. 5.

Effect of phospholipids on modulation of CYP11A1 activity by different drugs. Dashed and gray bars correspond to activity measurements in the presence or absence of DLPC, respectively, after normalization to basal CYP11A1 turnover: 2.6 min−1 in the presence of DLPC and 2.0 min−1 in the absence of DLPC. The results are the mean ± S.D of three independent measurements. Drugs mentioned in Sections 3 and 4 are shown in bold.
