
Fig. 7.
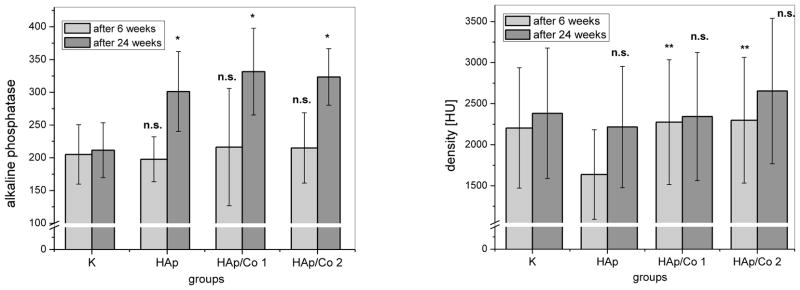
(a) ALP content (U/L) and (b) densities of alveolar bone expressed in Haunsfiled units (HU), 6 and 24 weeks after the implantation, for different experimental groups (HAp, HAp/Co1, HAp/Co2) and the control (K). K indicates healthy bone in (b). Data are shown as means with error bars representing standard deviation (* => p < 0.01 with respect to the control group; ** => p < 0.05 with respect to HAp group, n.s. => non-significant with respect to the control group).