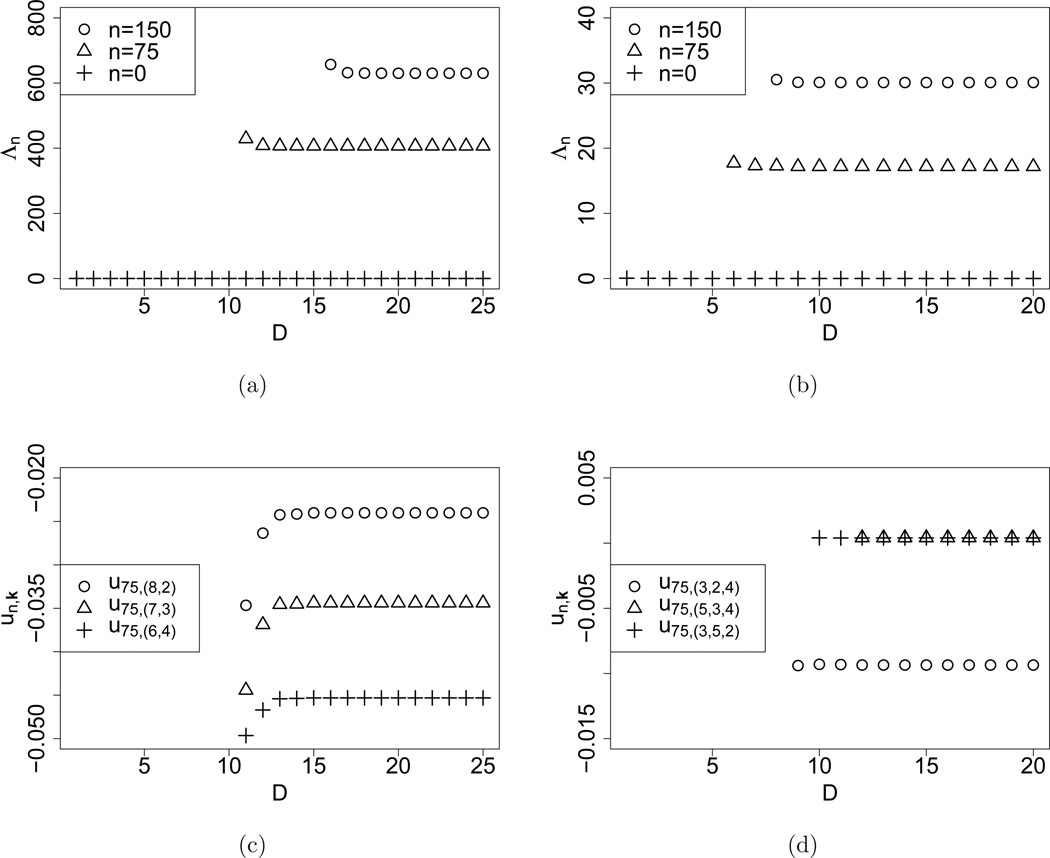
Figure 2.
Convergence of the truncated eigenvalues Λn and coefficients of the eigenvectors un as the truncation level D increases, for K = 3 with high mutation rates and for K = 4 with low mutation rates. Subfigures (a) and (c) show for n = 0, 75, 150, and for m = (8, 2), (7, 3), (6, 4), respectively, for mutation rates θ = (10, 20, 30) and selection coefficients σ = σ1. The convergence behavior for K = 4 is shown in subfigures (b) and (d) for with n = 0, 75, 150, and with m = (3, 2, 4), (5, 3, 4), (3, 5, 2), respectively; the mutation rates were set to θ = (0.01, 0.02, 0.03, 0.04) and the selection coefficients to σ = σ3.

