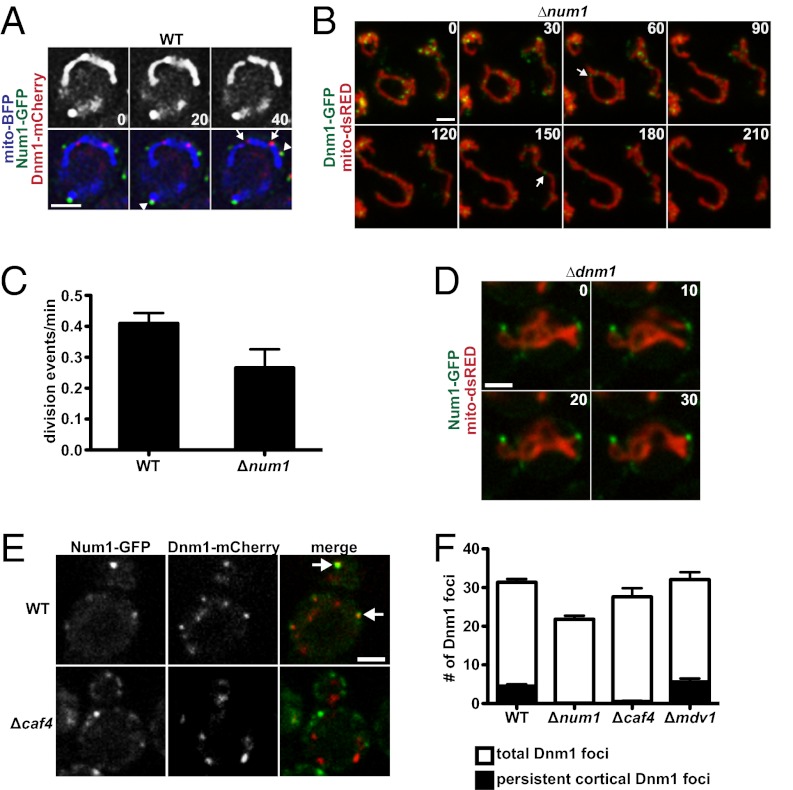
Fig. 4.
Num1 does not play a significant role in mitochondrial division. (A) Time-lapse images of wild-type cells expressing Num1-GFP, Dnm1-mCherry, and mito-BFP. Arrows indicate sites of mitochondrial division, and arrowheads indicate sites of Num1 and Dnm1 colocalization. A single focal plane is shown. (B) Time-lapse images of Δnum1 cells expressing Dnm1-GFP and mito-dsRED. Arrows indicate sites of mitochondrial division. Whole-cell projections are shown. (C) Quantification of the average number of mitochondrial division events observed per minute in wild-type and Δnum1 cells expressing mito-dsRED. The mitochondrial division rate of 25 cells was determined for each strain, and data are shown as the mean ± SE. (D) Time-lapse images of Δdnm1 cells expressing Num1-GFP and mito-dsRED. A single focal plane is shown. (E) Wild-type and Δcaf4 cells expressing Num1-GFP and Dnm1-mCherry. A single focal plan is shown. Arrows indicated colocalization of Dnm1 and Num1. (F) Quantification of the number of Dnm1 foci persistently localized to the cell cortex in the indicated cells. To be considered persistently localized, foci had to remain stationary at the cortex for ≥1 min. Data are shown as the mean ± SE. For each cell type, Dnm1 foci in 20 cells were counted. For all time-lapse series, time is shown in seconds. (Scale bars, 2 μm.)

