
Fig. 5.
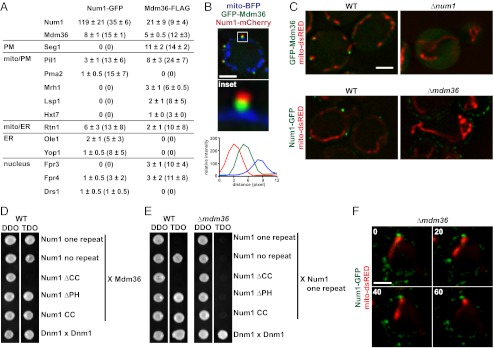
Mdm36 is a component of the Num1 mitochondria–cell cortex tether. (A) Proteomic analysis of Num1-GFP and Mdm36-FLAG immunoprecipitations as described in Methods. For each on-bead digest of the indicated purification, the number of peptides (and percent coverage) is shown for each identified protein. Data are shown as the mean ± SE of three independent experiments. (B) Cells expressing mito-BFP, GFP-Mdm36, and Num1-mCherry were analyzed by fluorescence microscopy. A single focal plane is shown. The boxed area is magnified fivefold in the Inset . The graph shows the relative fluorescence intensities of Num1 (red), Mdm36 (green), and mitochondria (blue) along a line drawn through the center of the Num1 and Mdm36 foci. (C) Images of wild-type and Δnum1 cells expressing GFP-Mdm36 and mito-dsRED (Upper) and wild-type and Δmdm36 cells expressing Num1-GFP and mito-dsRED (Lower). A single focal plane is shown. (D) Yeast two-hybrid analysis to assess the interaction of a Gal4BD-Mdm36 fusion with the indicated Gal4AD-Num1 fusions. Protein–protein interactions were assessed by growth on triple-dropout (TDO) medium. Dnm1 self-interaction was used as a positive control. TDO, SC−Leu−Trp−Ade; double-dropout medium (DDO), SC−Leu−Trp. (E) Yeast two-hybrid analysis to assess the interaction of a Gal4AD-Num1 one repeat fusion with the indicated Gal4BD-Num1 fusions in the presence (WT) or absence (Δmdm36) of Mdm36. Protein–protein interactions were assessed as in D. (F) Time-lapse images of Δmdm36 cells expressing Num1-GFP and mito-dsRED. A single focal plane is shown. Time is shown in seconds. (Scale bars, 2 μm.)