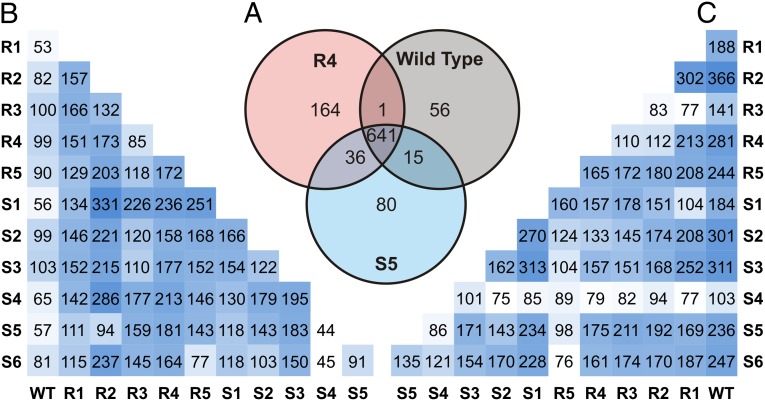
Fig. 2.
Feature production comparison for mutants and wild type as generated through binary comparisons using OPLS-DA. (A) A standard Venn diagram depicting the number of unique and shared features for select mutants and wild type via the three-way comparison. (B) Comparison of unique features specific to bottom-row organism compared with left-column organism. (C) Features unique to right-column organism compared with bottom-row organism. Values from tables in B and C were generated via pairwise comparison and hence cannot be compared with those of the tripartite comparison in A.

