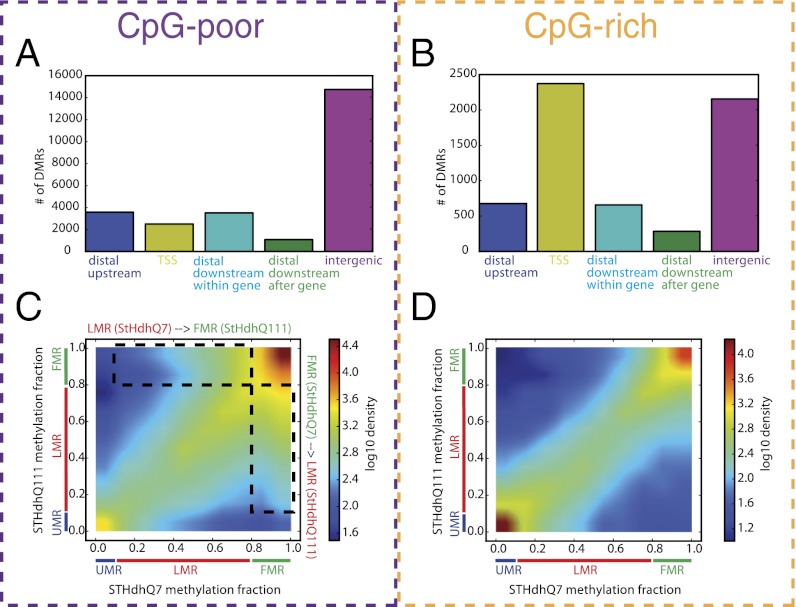
Fig. 1.
Characterization of differentially methylated regions. (A and B) Number of differentially methylated regions adjacent to the TSS (−2 kb to +2 kb from the TSS), upstream (−20 kb to −2 kb from the TSS), downstream within gene (+2 kb to +20 kb from the TSS and before the transcription end site), downstream after gene (+2 kb to +20 kb from the TSS and after the transcription end site), and intergenic (farther than 20 kb to closest TSS) for CpG-poor regions (A) and CpG-rich regions (B). (C and D) Comparison of the fraction of CpGs that are methylated in each region in STHdhQ7 (x axis) and STHdhQ111 (y axis). The color scale indicates the density of regions with corresponding levels of methylation (increases from blue to red). CpG-poor regions (C) and CpG-rich regions (D) are shown separately. Unmethylated regions (UMRs) are defined as regions with 0–10% methylation, low methylated regions (LMRs) as 10–80%, and fully methylated regions (FMRs) as 80–100%.

