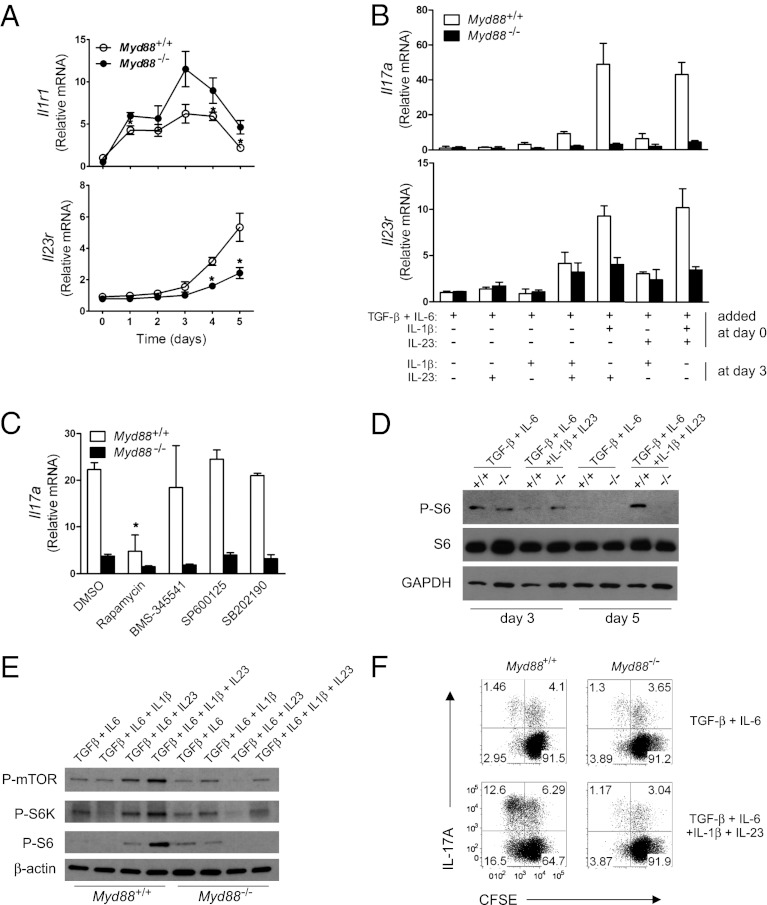
Fig. 4.
IL-1 and IL-23 signaling sequentially promotes Th17 cell proliferation. (A) The amounts of Il1r1 and Il23r mRNA during Th17 cell differentiation (with TGF-β + IL-6 + IL-1β + IL-23) were quantified by qRT-PCR. *P < 0.05. (B) CD4+ T cells were activated and cultured with the indicated cytokines for 3 d. At the end of day 3, additional cytokines were added to the indicated cultures. On day 5, qRT-PCR was performed to measure the levels of Il17a and Il23r mRNA. (C) Cells were cultured under Th17-polarizing conditions for 3 d. The indicated inhibitors ( 0.1 μM rapamycin, 5 μM BMS-345541, 10 μM SP600125, and 5 μM SB202190) or DMSO was added at the end of day 3. On day 5, mRNA expression of Il17a was quantified by qRT-PCR. *P < 0.05, DMSO vs. inhibitors treatment in WT. (D) CD4+ T cells from WT (designated +/+) or Myd88−/− (designated −/−) mice were activated and cultured with indicated cytokines. The whole-cell lysates were prepared on day 3 or day 5. P-S6, S6, and GAPDH were detected by immunoblot analysis. (E) Cells were activated and cultured with the indicated cytokines. At day 5, the whole-cell lysates were prepared. P-mTOR, P-S6K, P-S6, and β-actin were detected by immunoblot analysis. (F) Cells were activated and cultured with the indicated cytokines for 3 d. At the end of day 3, cells were washed, labeled with carboxyfluorescein diacetate succinimidyl ester, and cultured in T-cell medium for additional 3 d in the presence of same cytokines. Carboxyfluorescein diacetate succinimidyl ester dilution and IL-17A expression were analyzed by flow cytometry. Results are representative of two independent experiments (A and E) or three independent experiments (B, C, D, and F).

