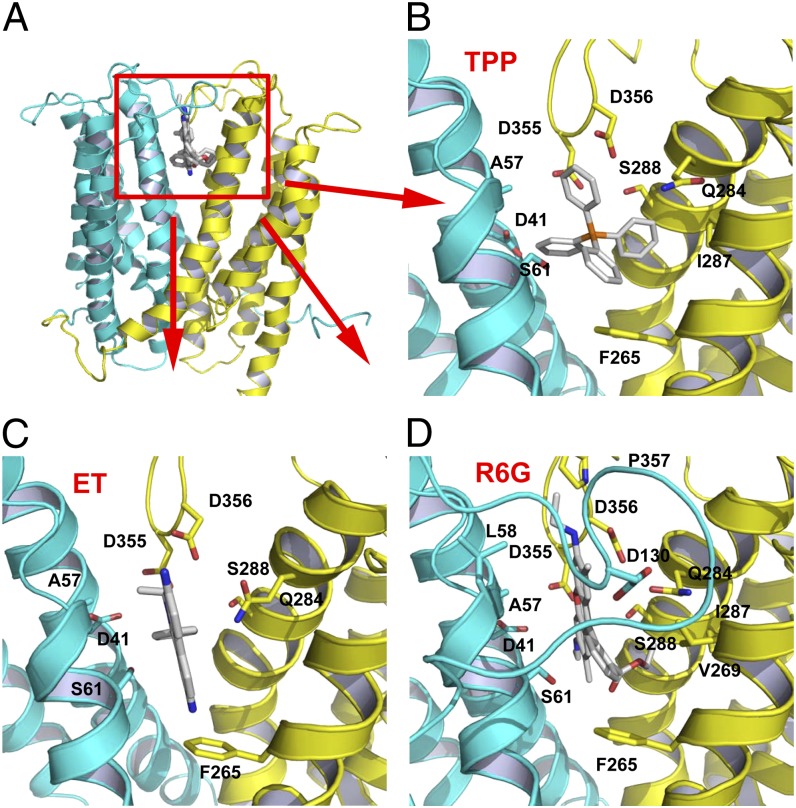
Fig. 2.
Structure of the multidrug-binding site. (A) NorM-NG is drawn as a ribbon, whereas the substrates are in stick representation. (B–D) Closeup of the binding site for TPP, ethidium (ET), and R6G, respectively. Amino acids within 4.5 Å (given the ∼0.6-Å coordinate errors at current resolutions) of the substrate are illustrated as sticks. L3-4 was omitted in B and C for clarity.

