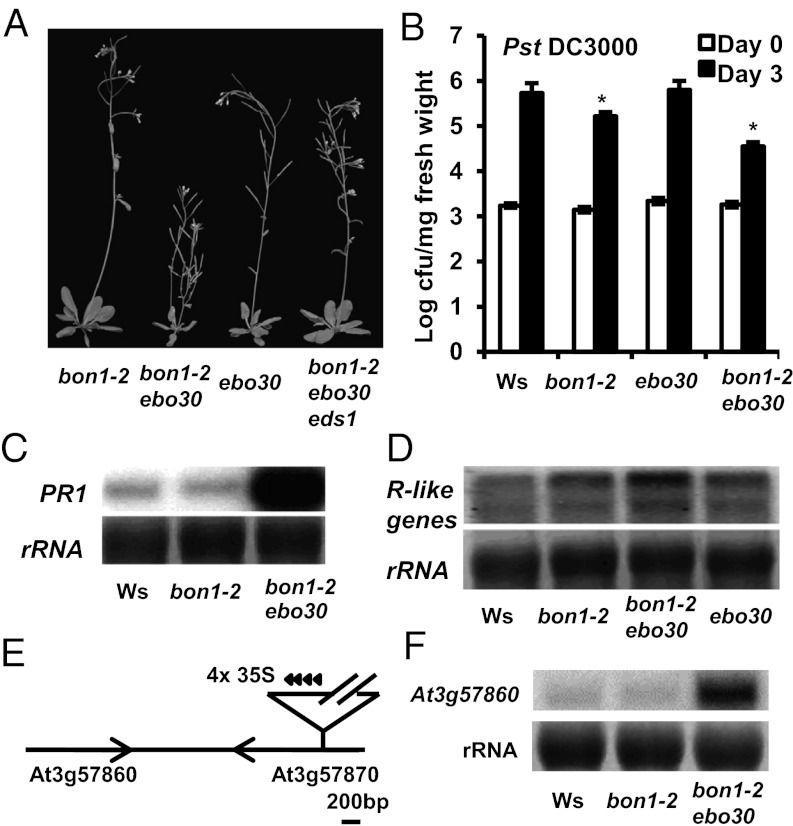
Fig. 1.
ebo30 mutation enhances the bon1-2 phenotype. (A) Morphology of bon1-2, bon1-2 ebo30, ebo30, and bon1-2 ebo30 eds1 plants grown at 22 °C for 4 wk. (B) Growth of virulent bacterial pathogen Pst DC3000 in Ws, bon1-2, ebo30, and bon1-2 ebo30 at day 0 and day 4 after inoculation. The asterisk indicates a statistically significant difference from Col-0 determined by the Student t test (P < 0.05). (C and D) Expression of PR1 (C) and R genes (D) in Ws, bon1-2, and bon1-2 ebo30 were analyzed by RNA blotting. rRNAs were used as loading controls. (E) Diagram of the genomic region around the ebo30 mutation. The activation tag is inserted in At3g57870, which is adjacent to At3g57860. (F) Expression of At3g57860 in bon1-2 ebo30 analyzed by RNA blotting.

