Fig. 5.
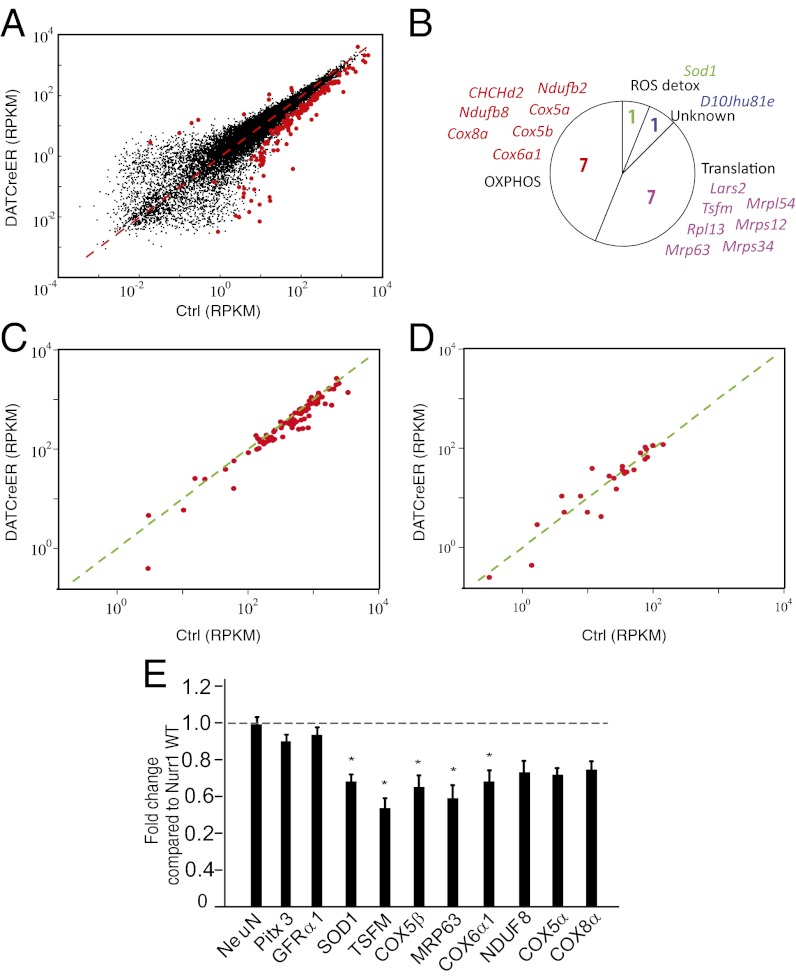
RNA sequencing of control and Nurr1-ablated DA neurons. (A) Scatter diagram showing all detected genes. Differentially expressed genes are highlighted by red dots. The x-axis shows mRNA sequencing RPKM values from control cells; the y-axis, mRNA sequencing RPKM values from Nurr1-ablated cells. (B) Circle diagram showing functional categories and gene names of significantly regulated nuclear-encoded mitochondrial genes. The majority of these genes encode either proteins involved in oxidative phosphorylation or mitochondrial translation. One gene (Sod1) is implicated in radical oxygen species (ROS) detoxification. (C) Scatter diagram highlighting genes encoding proteins involved in oxidative phosphorylation. The x-axis shows mRNA sequencing RPKM values from control cells; the y-axis, mRNA sequencing RPKM values from Nurr1-ablated cells. (D) Scatter diagram highlighting genes encoding proteins involved in fatty acid metabolism. The x-axis shows mRNA sequencing RPKM values from control cells; the y-axis, mRNA sequencing RPKM values from Nurr1-ablated cells. (E) qPCR analysis in Nurr1 ablated and control mice 8–10 wk after tamoxifen treatment. Data are expressed as mean ± SEM (n = 5 per group). *P < 0.05 compared with Nurr1WT/WT group.

