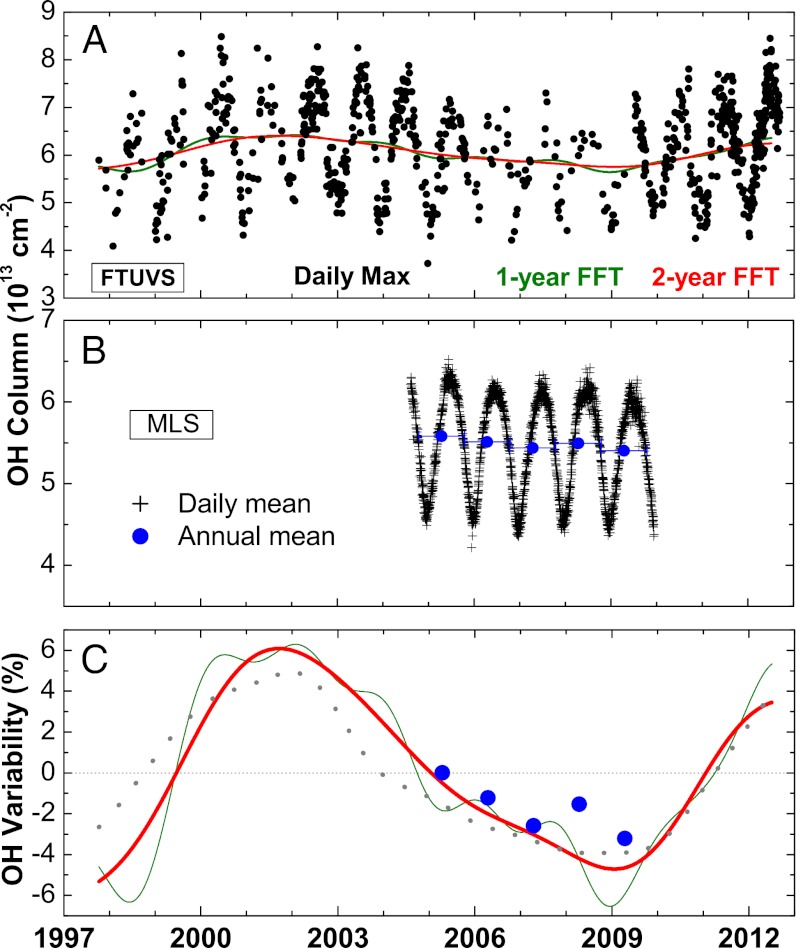
Fig. 1.
Daily max OH column at the TMF and its SC variability. (A) Daily max FTUVS XOH (black) and its long-term variability based on the FFT (red and green). (B) Daily mean (black) and annual mean (blue) MLS XOH values around the TMF latitude. (C) Long-term FTUVS XOH variability normalized to an all-time mean (red and green, from FFT; gray, from regression) and the comparable variability in MLS XOH (blue).

