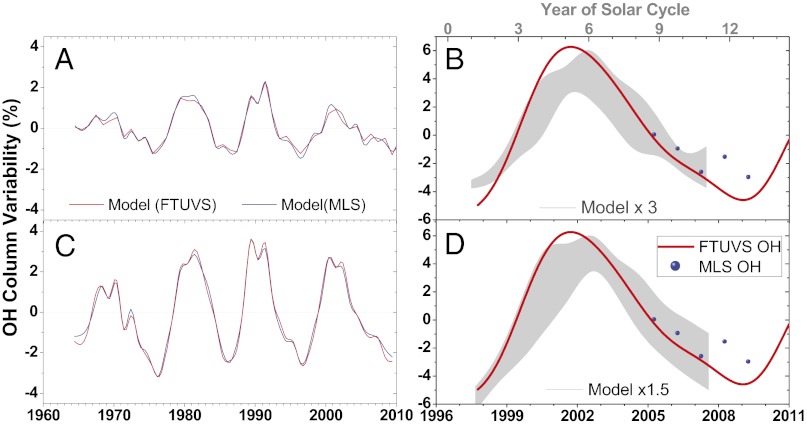
Fig. 3.
Comparison of OH SC variabilities from the WACCM and observations. (A) Modeled variability of annual mean XOH (using NRL SSI) integrated over the altitude ranges for FTUVS (red) and MLS (blue) XOH values. (B) Model XOH variability is increased by a factor of 3 (gray) to compare with observed XOH SC signal (red and blue). The gray band indicates the scatter range of model XOH variability over the simulated SCs. (C and D) Equivalent to A and B but for model results using SORCE SSI.

