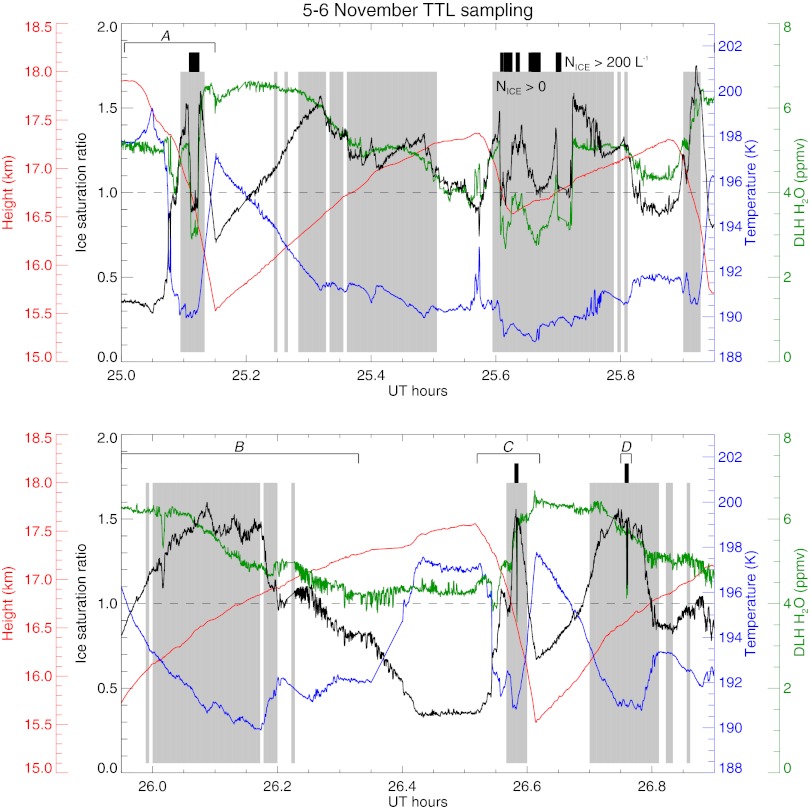
Fig. 1.
Time series of in situ measurements during ascents and descents through the TTL. Height (black), temperature (blue), water vapor mixing ratio (green), and ice saturation ratio (red). Gray shading indicates time periods when ice was detected, and black bars indicate times when high ice concentrations (>200 L−1) were present. The time ranges indicated by A–D correspond to the vertical profiles shown in Fig. 3.

