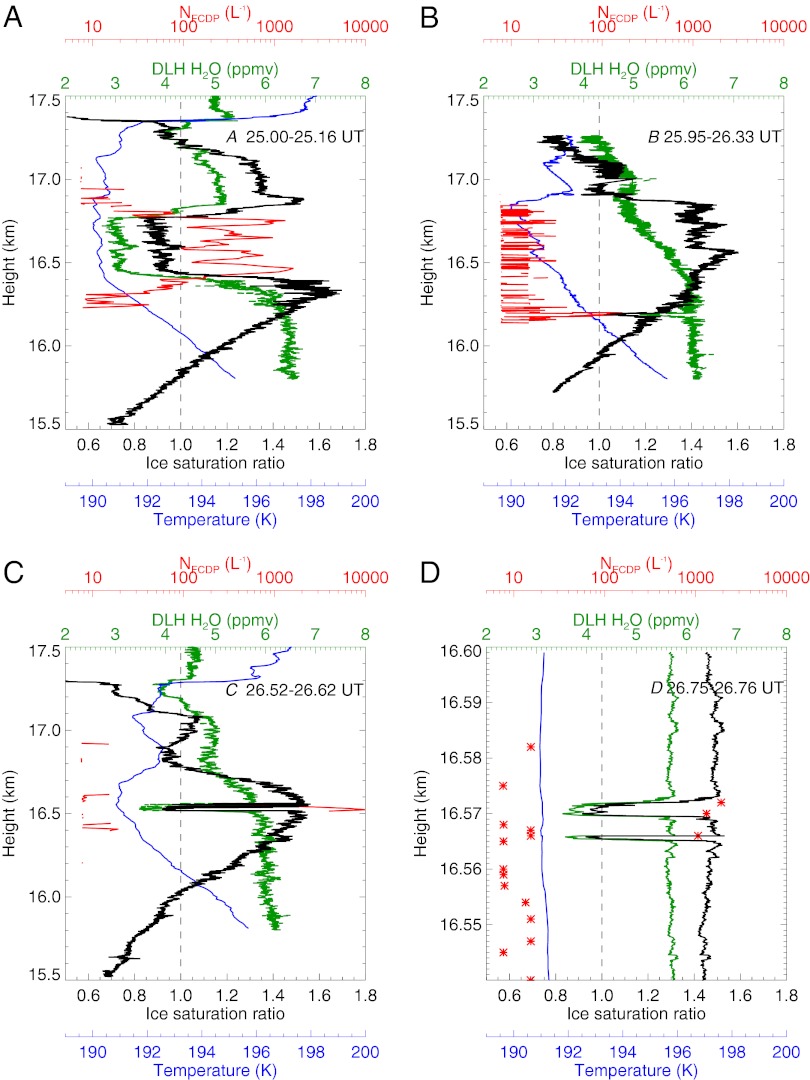
Fig. 3.
Vertical profiles of temperature (blue), water vapor mixing ratio (green), ice saturation ratio (black), and ice concentration (red) for individual profiles described in Fig. 1. (A, C, and D) Examples of cloud layers with high ice concentration, within which vapor in excess of ice saturation is depleted by ice growth. (B) Example of a deep layer with low ice concentration and persistent high ice supersaturation.

