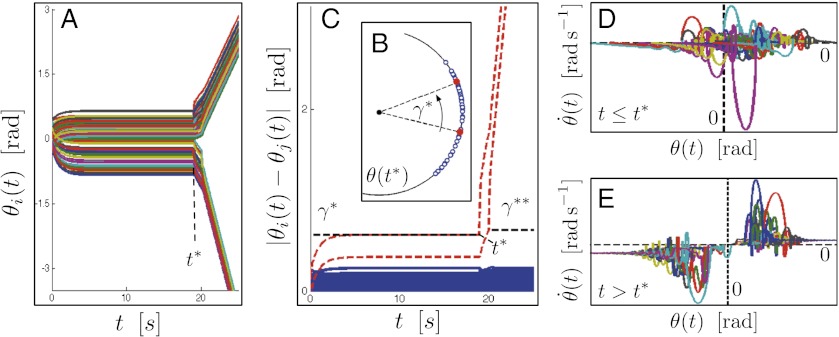
Fig. 5.
RTS 96 dynamics for a continuous load increase from 22.19% to 22.24%. (A) Angles θ(t) that lose synchrony at t* = 18.94 s, when the thermal limit γ* = 0.1977 rad of the transmission line {121, 325} is reached. (B) Angles θ(t) at t = t*. (C) Angular distances and the thermal limits γ* and γ**, where the lines {121, 325} and {223, 318} are plotted as dashed curves. (D and E) Generator phase space  before and after t*, where the loss of a common synchronization frequency can be observed.

