Fig. 4.
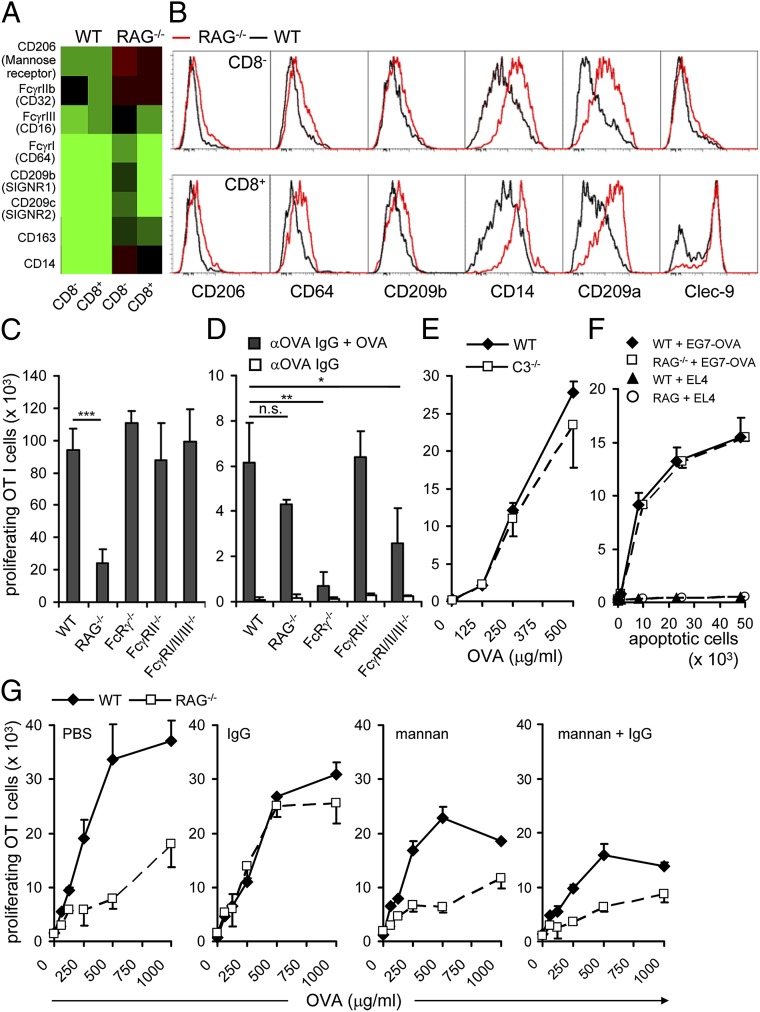
Ig promotes cross-presentation by cDCs via interaction with lectin receptors. (A) Expression analysis of candidate surface receptors in splenic cDCs. (B) Splenic cDCs of WT and RAG−/− mice were analyzed for expression of the indicated C-type lectin receptors. Data are representative of four mice per group in two independent experiments. (C) Splenic cDCs from WT, FcRγ−/−, FcγRII−/−, or FcγRI/II/III−/− mice were loaded with OVA (500 μg/mL) and incubated with CFSE-labeled OT I cells for 2 d. (D) Sorted splenic cDCs from RAG−/−, WT, Fcγc−/−, RcRγIIB−/−, and FcRγI/II/III−/− were loaded with αOVA IgG + OVA. Cross-presentation abilities were tested by coincubation with OT I cells. (E) Splenic cDCs from WT or C3−/− mice were analyzed as in C. (F) Sorted splenic cDCs from RAG−/− and WT mice were loaded for 1h with 5 × 10⁴ UV-irradiated EG7-OVA or EL4 cells. Further cells were coincubated with CFSE-labeled OT I cells. (G) WT and RAG−/− recipient mice were first injected i.v. with mannan (200 μg per mouse) and, subsequently, with IgG (7.5 μg per mouse) every 3 d for 21 d. Data are representative of two independent experiments with minimum three mice per group. The proliferative response of T cells was enumerated by flow cytometry. Numbers of proliferating cells are shown (mean +SEM). Statistical significance was determined by using paired Student’s t test. *P < 0.05; **P < 0.01; ***P < 0.005; n.s., not significant.

