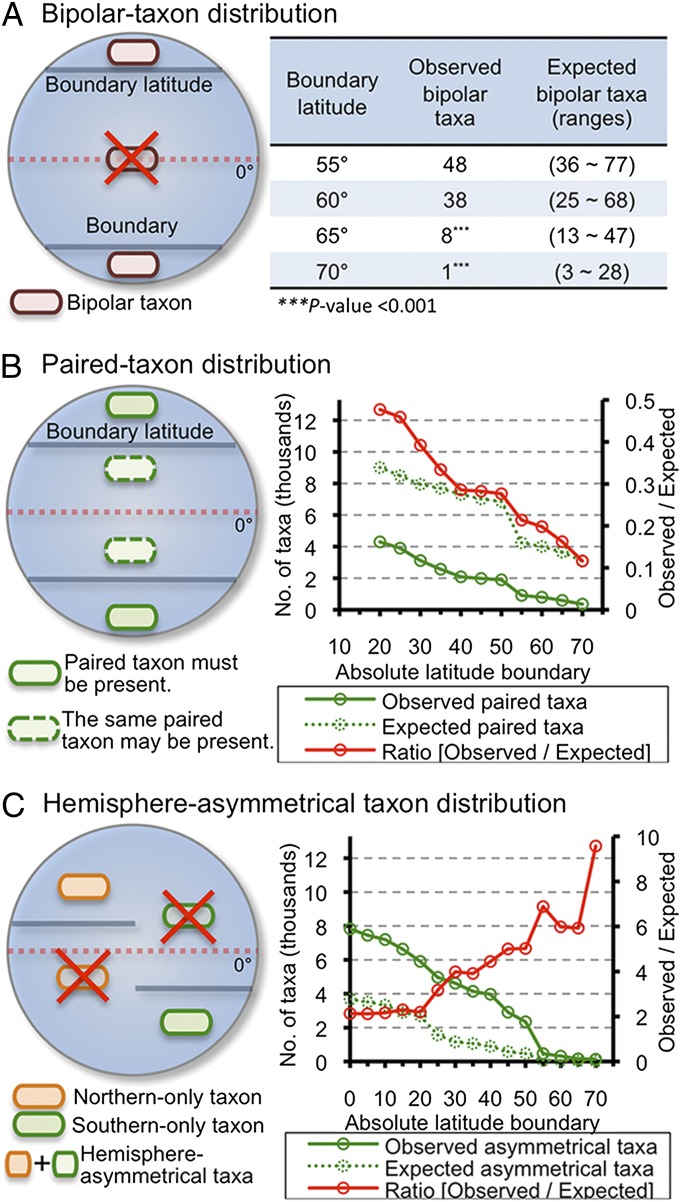
Fig. 2.
Nonrandom global biogeographical patterns of marine epipelagic bacteria. (A) A schematic illustration of the bipolar taxon distribution, where taxa occur only above the subtropics on both sides of the equator. Table (Right) compares observed bipolar-distributed taxa vs. expected ones. (B) A schematic illustration of a paired-taxon distribution. The numbers of observed, expected, and the ratio of observed-to-expected paired taxa are shown in the graph (Right). (C) A schematic illustration of a hemisphere-asymmetrical taxon distribution, whereby taxa occur only above a boundary latitude in a selected hemisphere. The numbers of observed, expected, and the ratio of observed-to-expected hemisphere-asymmetrical taxa are shown in the graph (Right). All expected numbers of taxa and P values were obtained from null-simulation (i.e., random-distribution) based matrix randomization processes with 1,000 iterations.

