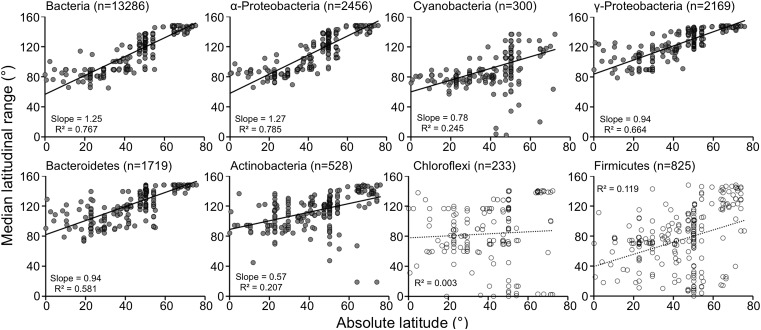
Fig. 4.
Limited bacterial latitudinal ranges by taxonomic group. Relationship between bacterial latitudinal range sizes and latitude to test conformation to the Rapoport rule. Each point represents a median latitudinal range for each sample with taxa of a given taxonomy (n = numbers of taxa used in the calculation; “slope” indicates slope of linear regression).

