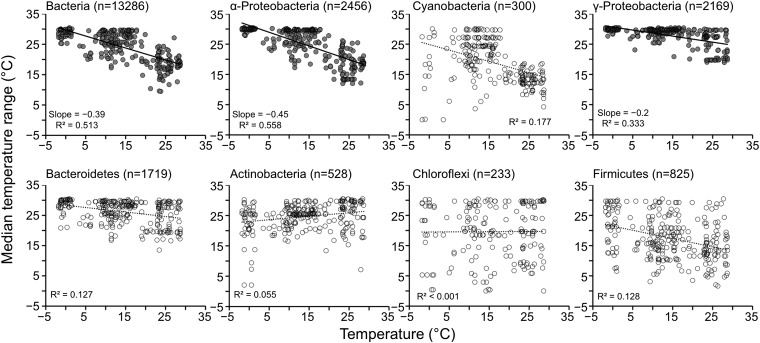
Fig. 5.
Limited bacterial temperature ranges by taxonomic group. Relationship between bacterial temperature range sizes and temperature to see if broader mean temperature range sizes were measured in colder locations than in moderate or warmer locations. Each point represents the median temperature range for each dataset with taxa of a given taxonomy (n = numbers of taxa used in the calculation; “slope” indicates slope of linear regression).

