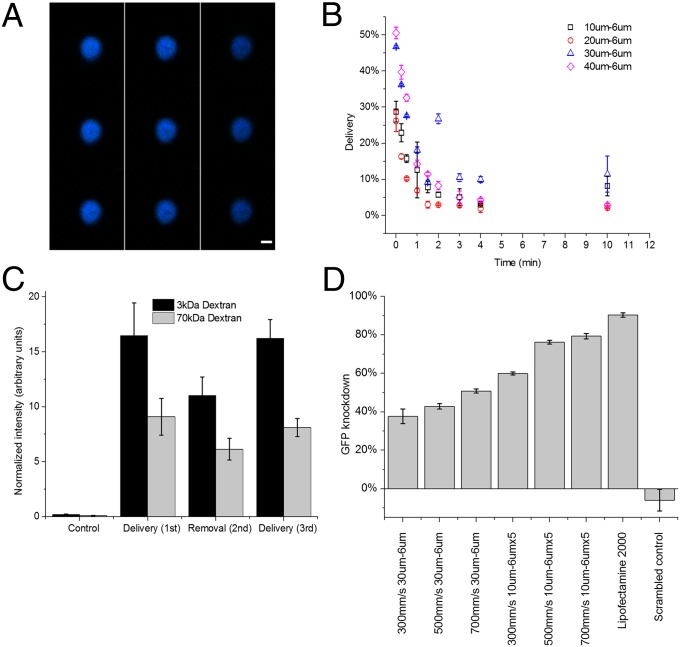
Fig. 3.
Diffusive delivery mechanism. (A) Scans of different horizontal planes of a HeLa cell after the delivery of Cascade Blue-conjugated 3-kDa dextran, as measured by confocal microscopy. Note that 3-kDa dextran is small enough to enter the nuclear envelope (43). Scans read from top to bottom, and then left to right, where the top left is at z = 6.98 μm and bottom right is at z = −6.7 μm. (Scale bar: 6 μm.) (B) Live-cell delivery efficiency of 10 μm − 6 μm (□), 20 μm − 6 μm (○), 30 μm − 6 μm (∆), and 40 μm − 6 μm (◇) devices. The time axis indicates the amount of time elapsed from initial treatment of cells before they were exposed to the target delivery solution. All results were measured by flow cytometry 18 h after treatment. (C) Average intensity of the delivered cell population normalized by untreated cells to control for autofluorescence. Fluorescein-conjugated 70-kDa dextran and Cascade Blue-conjugated 3-kDa dextran are delivered to the cell (cycles 1 and 3) and removed from the cell (cycle 2) in consecutive treatment cycles. The control represents cells that were only exposed to the delivery solution and not treated by the device. (D) Gene knockdown, as a function of device type and cell speed, in live destabilized GFP-expressing HeLa cells 18 h after the delivery of anti-eGFP siRNA at a delivery concentration of 5 μM. Lipofectamine 2000 was used as a positive control and scrambled controls were run at 500 mm/s on a 10 μm − 6 μm × 5. All data points were run in triplicate, and error bars represent 2 SDs.

