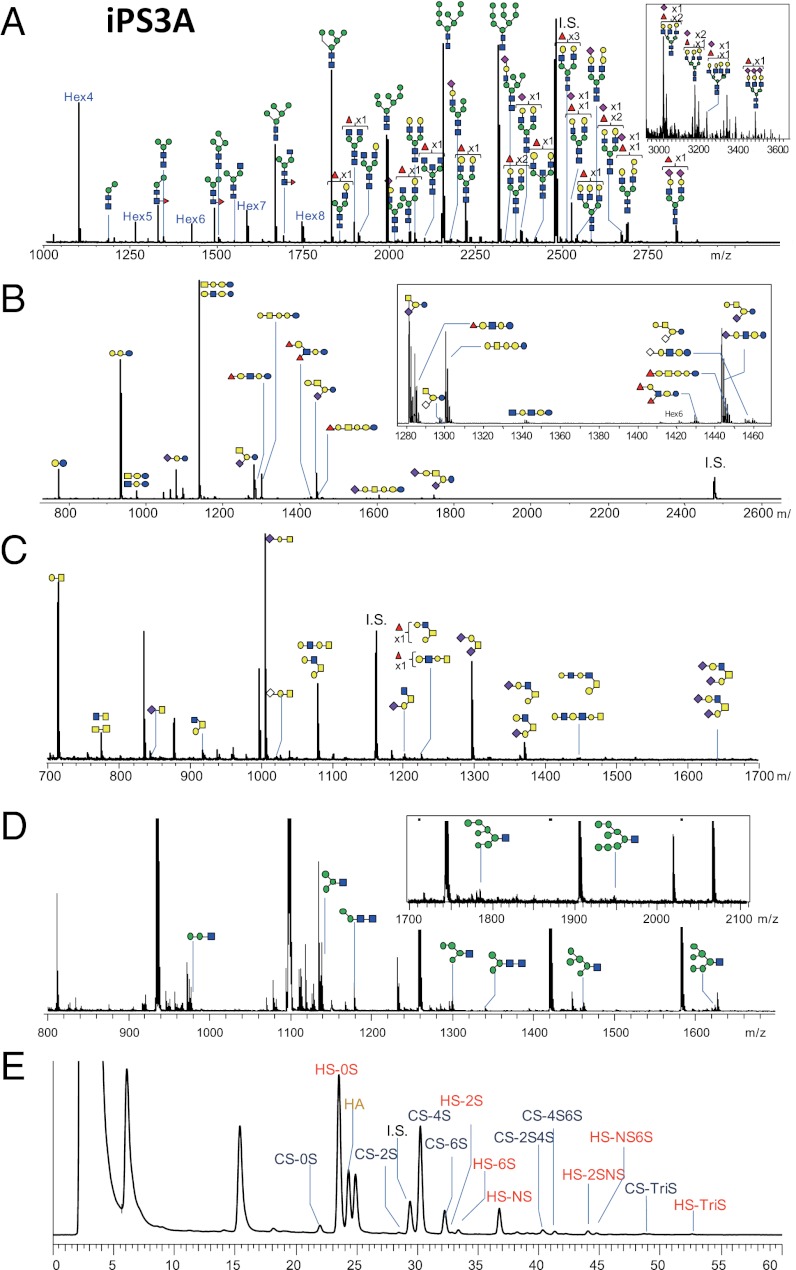
Fig. 2.
Representative MS spectra and chromatograms showing the glycomic profiles obtained for induced pluripotent stem cell line (iPS3A): (A) N-glycans, (B) GSL glycans, (C) O-glycans, (D) FOSs, and (E) GAGs. Estimated structures are shown. Green circle, Man; yellow circle, Gal; blue square, GlcNAc; yellow square, GalNAc; red triangle, Fuc; purple diamond, Neu5Ac; open diamond, Neu5Gc.

