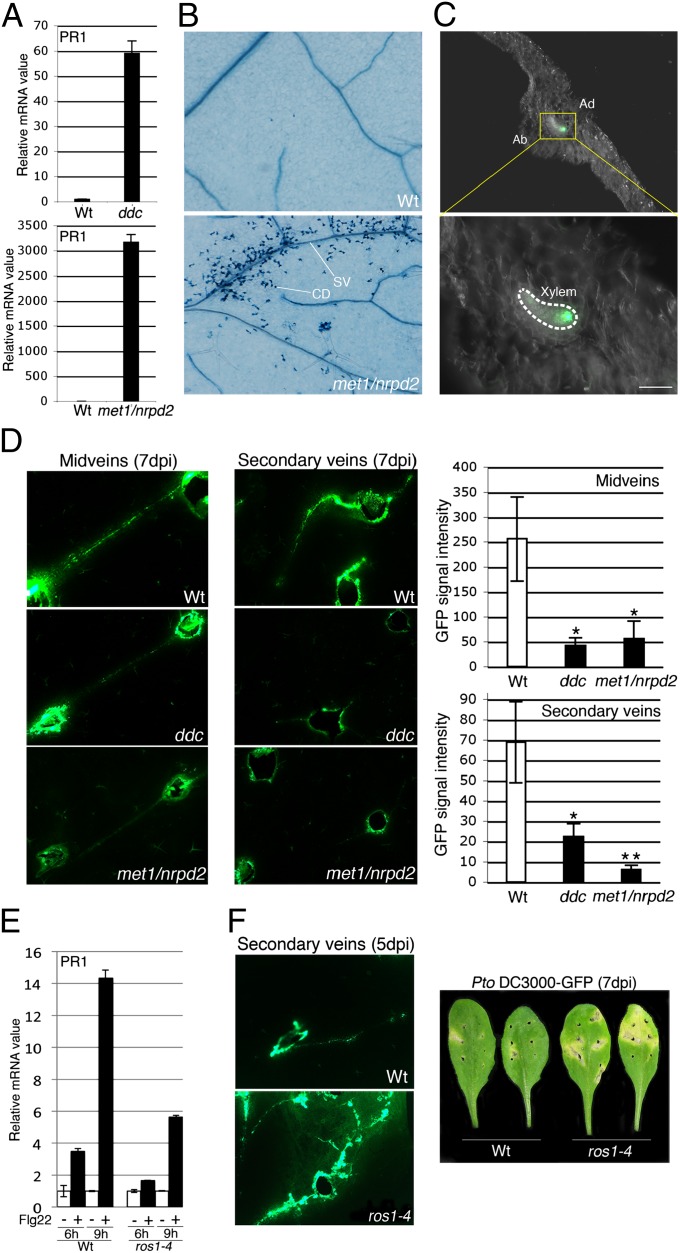
Fig. 3.
(A) PR1 mRNA levels with SD as in Fig. 1. Similar results were obtained in two independent experiments. (B) Trypan blue-stained nontreated WT and met1-3(−/+)/nrpd2-2 leaves. SV and CD stand for secondary vein and cell death, respectively. Cell death is observed around secondary veins but also at the base of some trichomes in the met1/nrpd2 background. Similar results were obtained in two independent experiments. (C) Five- to 6-wk-old leaves of WT were wound inoculated with a toothpick in midveins with Pto DC3000–GFP at 5 × 10⁷ cfu/mL and GFP signal monitored under UV light from transversal sections of leaf blades performed in between two inoculation sites. Pictures were taken at 7-d postinfection (dpi). Ad and Ab stand for adaxial part of the leaf and abaxial part of the leaf, respectively. (Scale bar, 0.05 mm.) Similar results were obtained in three independent experiments. (D) Five- to 6-wk-old leaves of WT, ddc, and met1-3 (−/+)/nrpd2-2 were wound inoculated in midveins or secondary veins as in C and pictures were taken at 7 dpi (Left). GFP fluorescence intensity in midveins or in secondary veins (Right). Asterisks represent significant differences in GFP fluorescence intensity (*P < 0.05; **P < 0.01). Similar results were obtained in three independent experiments. (E) WT and ros1–4 leaves were treated with water (mock) or 1 μM of flg22 for 6 and 9 h and PR1 transcript levels analyzed by RT-qPCR. Error bars: SD from three independent PCR results. Similar results were obtained in four independent experiments. (F) WT and ros1–4 leaves were wound inoculated as in C and GFP signal monitored at 5 dpi as in C (Left). Pictures of bacterial disease symptoms on WT and ros1–4 wound-inoculated leaves (Right). Similar results were obtained in four independent experiments.

