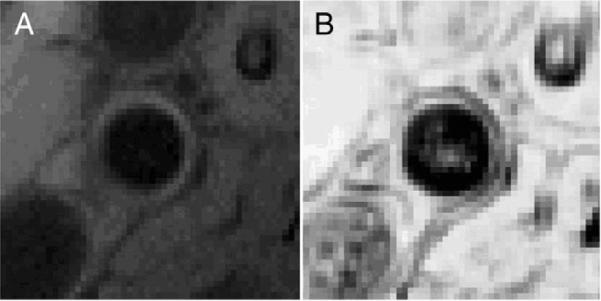
Fig. 4.

(A) Cross sectional view of the magnitude image for the right common carotid of one patient showing and (B) the calculated R2 map showing the goodness of fit at each voxel. Hypointense boundaries are emphasized in the R2 map due to the poor fit of T2* at tissue boundaries.
