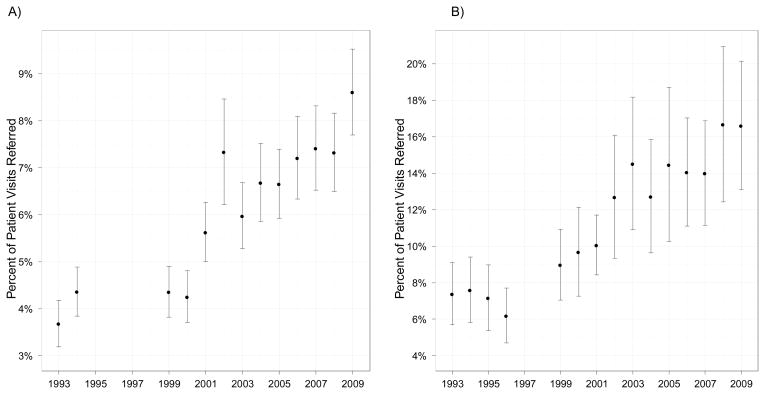
Figure 1. Referral Rates in the US, 1993–2009, by Practice Setting.
Fig. 1A shows referral rates in the US for physicians in office-based practices (NAMCS), while Fig. 1B shows referral rates for physicians in hospital outpatient department-based practices (NHAMCS). Data on referral rates not available from 1995–1999 for NAMCS (Fig. 1A) and 1998–1999 for NHAMCS (Fig. 1B). Error bars show 95% confidence intervals.

