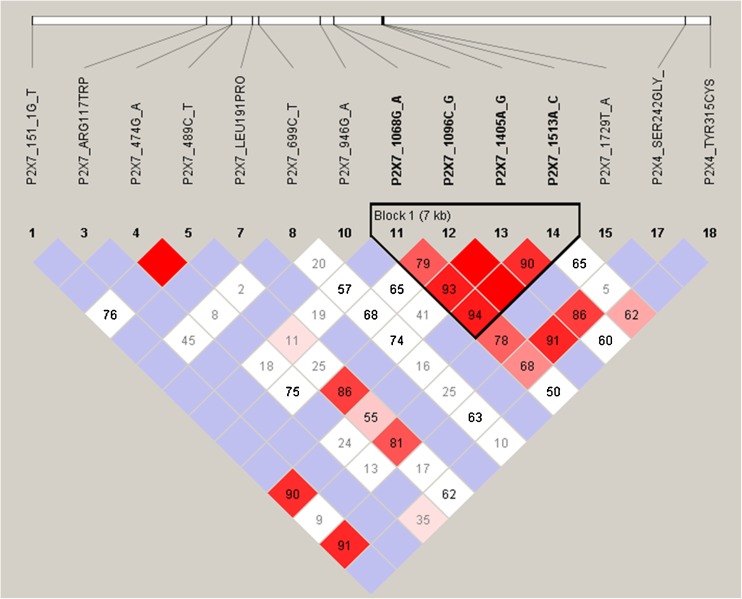
Fig. 2.
Haploview analysis of pairwise linkage disequilibrium between P2X4 and P2X7 SNPs using 14 marker SNPs that change receptor function. Plot of relative D′/LOD scores between the P2X4 and P2X7 SNPs from Dutch Caucasian subjects produced by the Haploview program. Standard color scheme is displayed as follows: bright red (D′ = 1; LOD ≥ 2), blue (D′ = 1; LOD < 2), shade of pink/red (D′ < 1; LOD ≤ 2), and white (D′ < 1; LOD < 2). Numbers represent D′ scores for pairwise linkage disequilibrium

