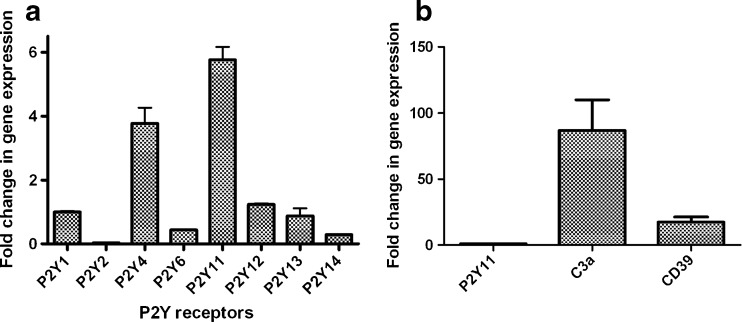
Fig. 8.
a Expression of P2Y receptor genes determined using qRT-PCR in LAD2 cells. GAPDH was used as an endogenous control in each separate experiment. The expression level of the P2Y receptors was calibrated based on the expression level of GAPDH. The expression level of the P2Y1R was arbitrarily expressed as 1. The gene expression levels of other P2YRs were expressed as their relative values to that of the P2Y1R. b Gene expression levels of C3a and CD39 in LAD2 cells in comparison to the most expressed P2Y receptor, P2Y11R. Quantitative analysis of data was performed by using the ΔΔCt method [17]. Results are expressed as mean ± SE from three separate experiments performed in triplicate

