Fig. 1.
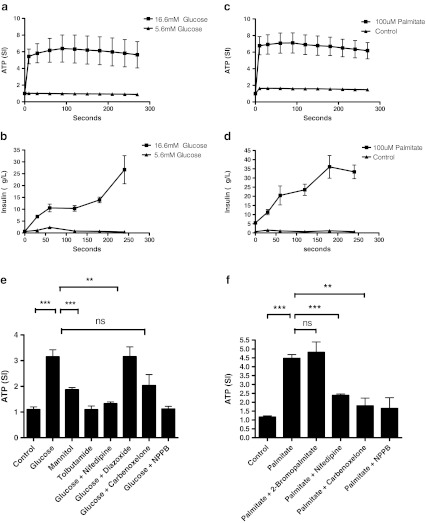
ATP release and insulin secretion from MIN6c4 cells. ATP release analysis was performed as described under “Materials and methods” section. ATP release stimulated by 16.7 mmol/l glucose (a) or 100 μmol/l palmitate (c) was faster than the 16.7-mmol/l glucose- or 100-μmol/l palmitate-induced insulin secretion (b, d) under same conditions. e Addition of 16.7 mmol/l glucose, but not 16.7 mmol/l mannitol, resulted in a significant increase (p < 0.001) in ATP release that was decreased by the addition of the Ca2+ channel blocker nifedipine (20 μmol/l), the pannexin-1 blocker carbenoxolone (20 μmol/l) or the VRAC inhibitor NPPB (100 μmol/l). Diazoxide did not affect the glucose-induced ATP release, and tolbutamide itself did not cause ATP release. f The addition of 100 μmol/l palmitate resulted in a significant increase (p < 0.001) in ATP release that was attenuated by addition of the Ca2+ channel blocker nifedipine (20 μmol/l), the pannexin-1 blocker carbenoxolone (20 μmol/l) or VRAC inhibitor NPPB. 2-Bromopalmitate had no influence on palmitate-mediated ATP release. ATP release levels were normalized to baseline and expressed as means ± SEM was shown (n = 3). Asterisks denote probability level of random difference, by Student's t test. *p < 0.05, **p < 0.01, ***p < 0.001

