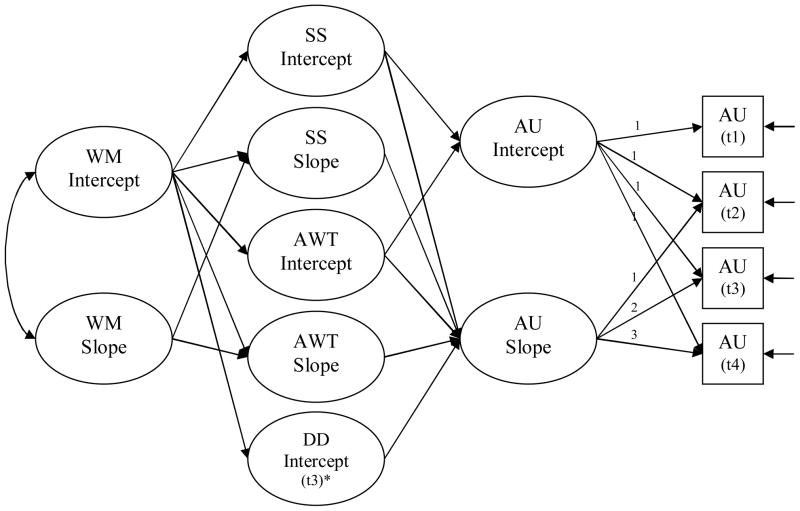
Figure 1.
Hypothesized model with an illustration of a linear latent growth curve for the Alcohol Use outcome variable only.
Note. WM = Working Memory, SS = Sensation Seeking, AWT = Acting Without Thinking, DD = Delay Discounting, AU = Alcohol Use frequency.
*Delay discounting was only assessed during the last two follow-ups and therefore it was not possible to model trajectories of change in DD. Both fixed and random components were estimated for each of the repeated measure variables. The residual variances in intercepts and slopes corresponding to each endogenous key variable will be correlated (correlations not shown here for reasons of clarity). Although not shown for the sake of clarity, direct paths from WM to AU intercept and slope were also included in the model.

