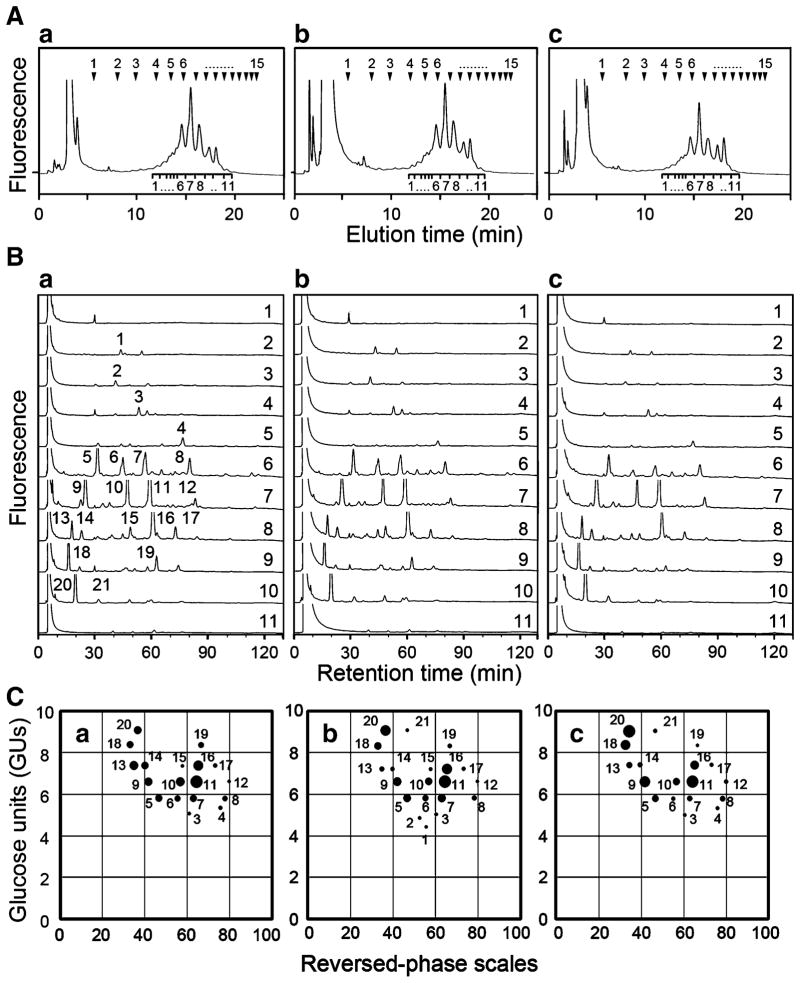
Fig. 3.
Characterization of PA-oligosaccharides by two-dimensional mapping method. A Size-fractionation HPLC profiles of PA-oligosaccharides derived from B4galt5+/+-, B4galt5+/−- and B4galt5−/−-derived MEF cells. PA-oligosaccharides were separated into 11 fractions by size-fractionation HPLC. Arrowheads at the top of panels indicate elution positions of PA-isomalto-oligosaccharides with 1–15 GUs. Panels a, b, and c indicate elution patterns of PA-oligosaccharides from B4galt5+/+-, B4galt5+/−-, and B4galt5−/−-derived MEF cells, respectively. B Reversed-phase HPLC profiles of PA-oligosaccharides in 11 fractions shown in (A). Panels a, b, and c indicate retardation patterns of individual PA-oligosaccharides from B4galt5+/+-, B4galt5+/−-, and B4galt5−/−-derived MEF cells, respectively. PA-oligosaccharides with significant amounts were separated into 21 peaks, and they were numbered in panel a as a representative. C Two-dimensional map of PA-oligosaccharides. The elution positions of each PA-oligosaccharide on size-fractionation and reversed-phase columns were expressed in GUs and reversed-phase scales, respectively, and plotted on the map. The relative amounts of individual PA-oligosaccharides were expressed as dot-sizes. Panels a, b and c indicate plots on the maps from B4galt5+/+-, B4galt5+/−-, and B4galt5−/−-derived MEF cells, respectively. Dot numbers are identical among panels a, b and c, and to those in panel a of (B)

