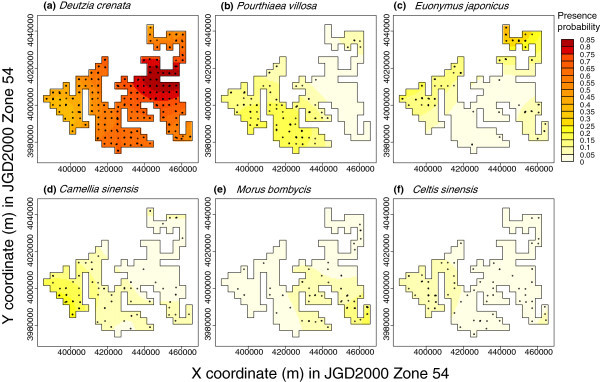
Figure 3.

Presence probability of the six most frequently used species. Multiple kernel density estimation was applied to the 28 species observed more than twice. Only six species that had a more than 5% gradient in estimated presence probability are illustrated. Circles indicate the locations where each species was recorded.
