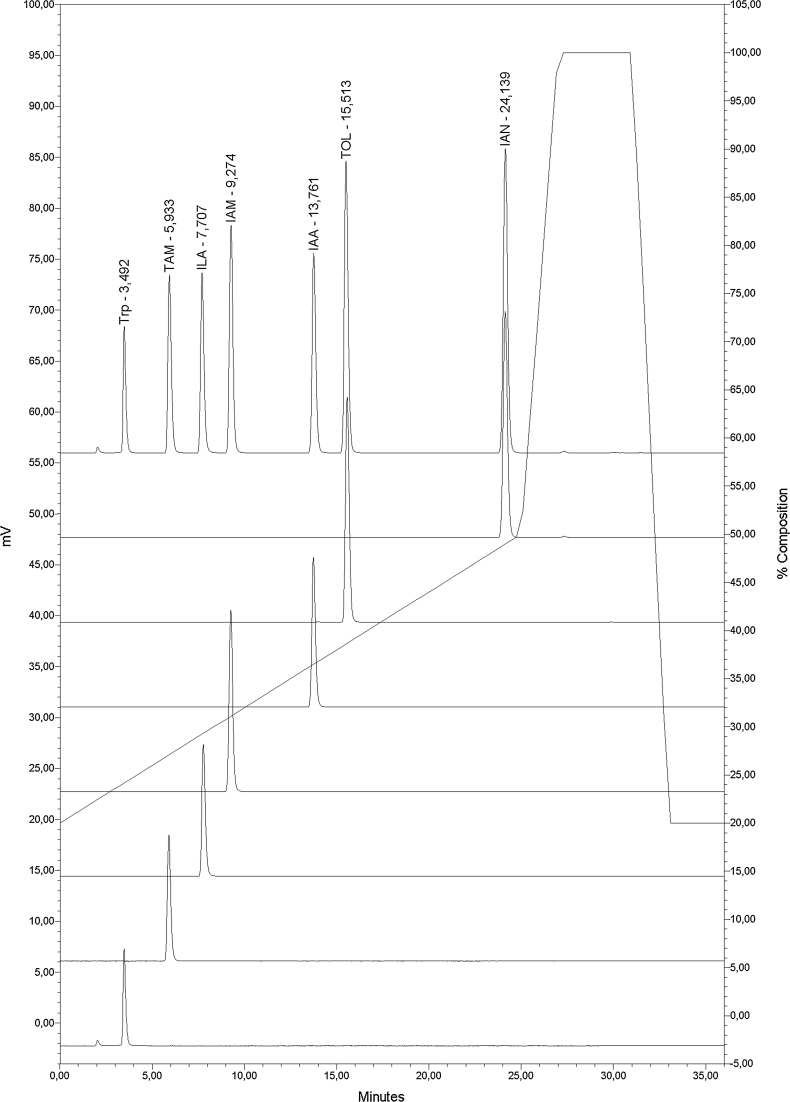
Fig. 2.
Representative chromatograms from the separation of indolic standards. Chromatogram on the top shows the separation of a mixture of all indolic standards (each at a concentration of 125 μg mL−1). Chromatograms from top to bottom show separation of each of the indolic standards (100 μg mL−1) separately. Solid line represents the gradient profile

