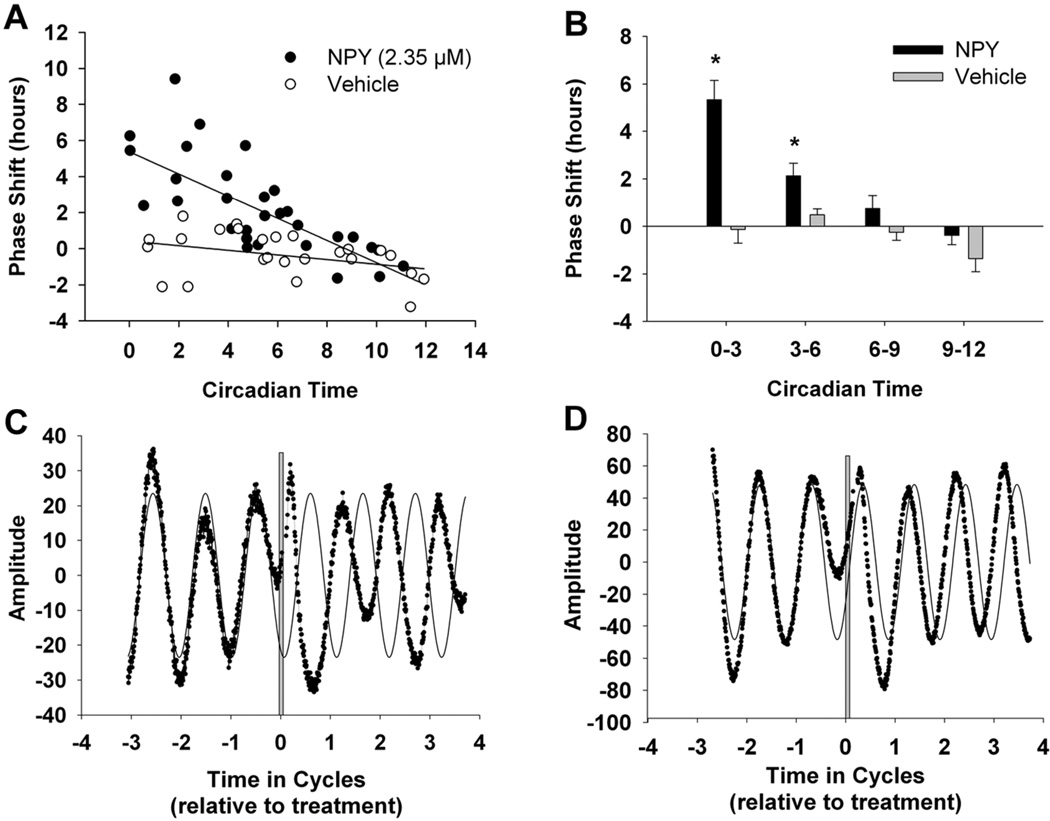
Figure 1. Phase specific NPY-induced phase advances of PER2 rhythms when applied during subjective day.
(A) Scatterplot of 1-h NPY application to SCN slice cultures from PER2::LUC mice at CT 0–12 and corresponding fitted regression lines. (B) Means and SEMs for phase shifts resulting from NPY- and vehicle-treated samples pooled into 3-h time bins (N = 10–20/NPY or vehicle subgroup). (C–D) Representative bioluminescent traces recorded from SCN explants from PER2::LUC mice after NPY treatment at CT 2 (C) or CT 6 (D). The thin solid black lines represent the fitted sine-wave curves for the pretreatment traces and extended for four cycles. Gray lines indicate treatment. *Significantly different from control treatment at intervals CT 0–3 and CT 3–6, p < .05.

