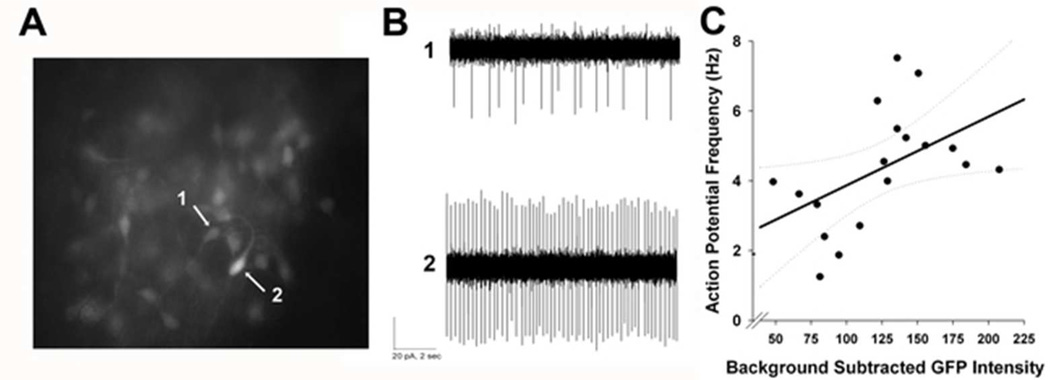
Figure 3. Spike rate is positively correlated with Per1-driven fluorescence.
(A) Representative photomicrograph of an SCN slice (N = 4) from a Per1::GFP mouse. Arrows indicate a dim cell (1) and a bright cell (2) within the same plane of view. (B) Representative traces from loose-patch electrophysiological recordings from cells (1) and (2) shown in (A). (C) Scatter plot depicting a significant correlation between fluorescence intensity and spike rate (Pearson correlation, R = .454, p < .05), as well as the fitted linear regression line and corresponding confidence intervals (95%).

