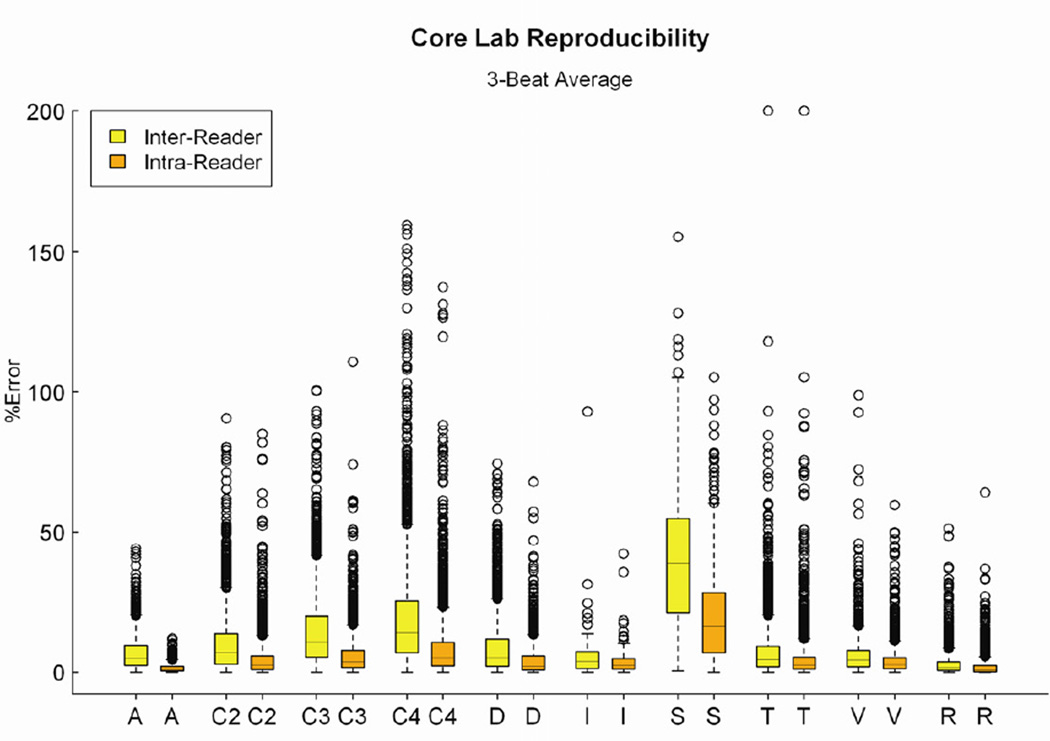
Figure 3.
Distributions for the raw data for core laboratory inter- and intra-observer % error for 3-beat averages of all 150 variables, classified into the categories described in figure 1. Each ‘box and whiskers’ plot displays the median, upper and lower quartiles and upper and lower extreme values of the % error. There was a significant upward skew of the distribution for the majority of the variable types. There were wide ranges of % error for individual variables, of the difference in intra and inter-observer percent error, and of the relative frequency and magnitude of the outliers.

