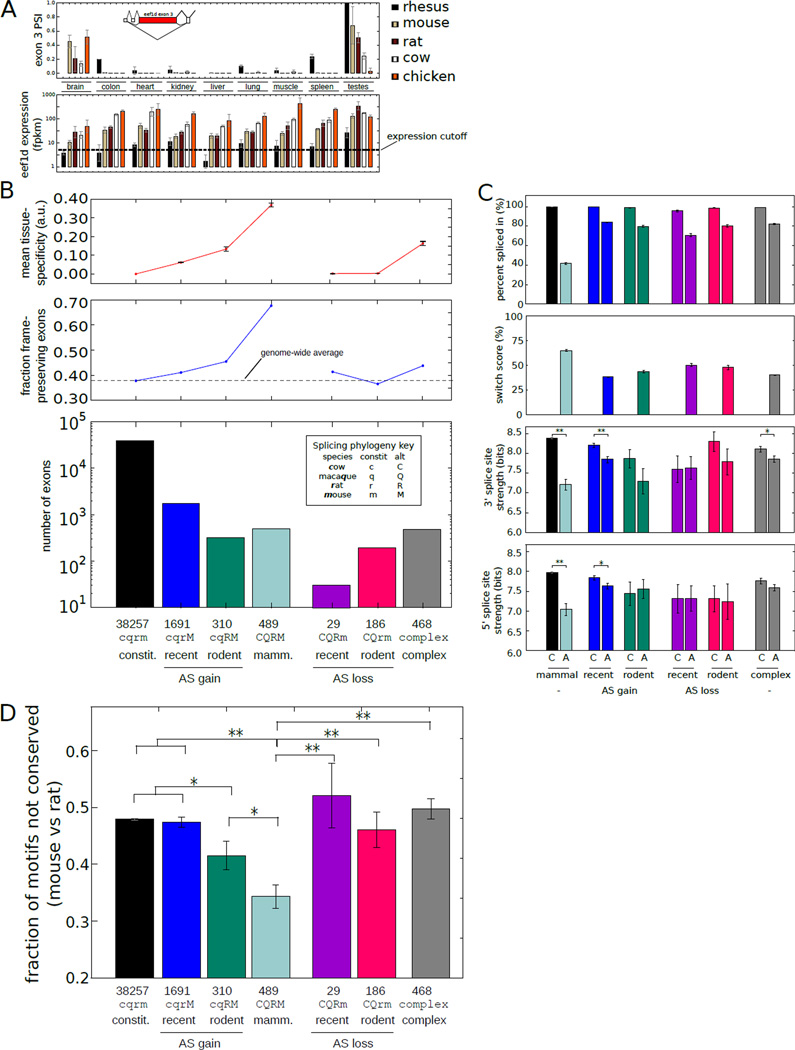
Figure 2. Exonic features associated with evolutionary change in alternative splicing.
A) Above: PSI values for eef1d exon 3 across tissues and species analyzed. Below: Eef1d gene expression values. (Mean ± SD of 3 biological replicates). PSI values were calculated only for tissues with FPKM ≥ 5. Inset: exon structure of 5' end of eef1d gene (ENSMUSG00000055762).
B) Below: Number of internal exons binned by the age of the inferred alternative splicing based on occurrence in ≥ 2 individuals. Above: The fraction of exons with length divisible by 3 and the mean and SEM of the tissue-specificity.
C) Top: mean ± SEM of PSI values of exons binned by the phylogenetic extent of alternative splicing as in (B). Middle: mean ± SEM of 3' splice site scores of exons in each bin. Bottom: mean ± SEM of 5' splice site scores. Splice sites were scored using the MaxEnt model (31). *Indicates t-test p-value < 0.05. **Indicates P < 0.001.
D) Fraction of regulatory 5mers in the downstream intron that differed between mouse and rat in exons binned by the phylogenetic extent of alternative splicing as in (B) (Mean ± SEM). *Indicates t-test P < 0.05 (t-test). **P < 0.001.

