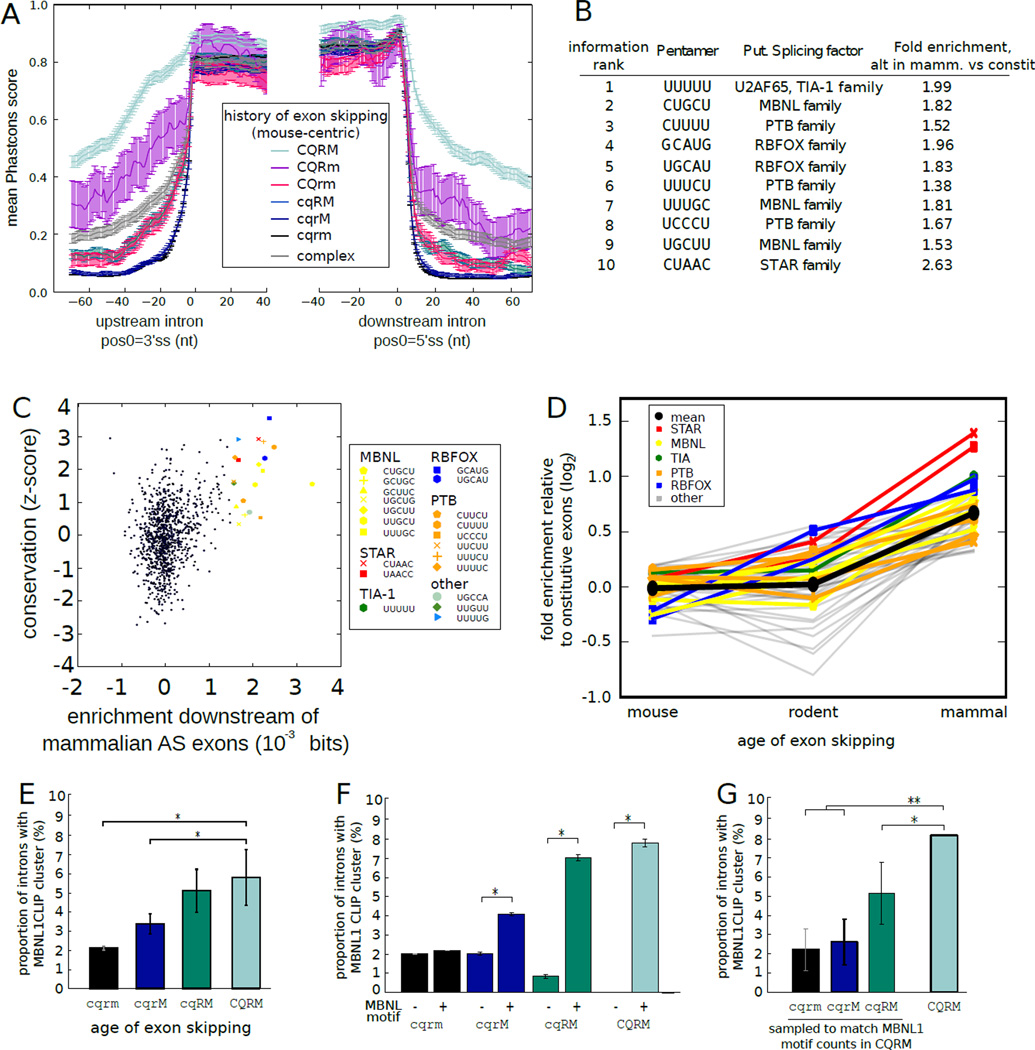
Figure 3. Tissue-specific regulatory motifs accumulate and are preferentially bound in broadly alternative exons.
A) Mean ± SEM of Phastcons scores (using the placental mammals alignment, with mouse coordinates) in exons and flanking introns grouped by phylogenetic pattern of alternative splicing. Splicing pattern indicated by letters adjacent to colored bars, as in Fig. 2B.
B) Top ten 5mers in broadly alternative exons relative to constitutive exons ranked by discrimination information (6).
C) The conservation of all 5mers (6) compared with their discrimination information. All 5mers with discrimination information ≥ 0.001 bits are highlighted. UUUUU was an outlier in enrichment (0.011 bits) and is not shown.
D) Fold enrichment (log2) relative to constitutive exons in downstream region was plotted for 5mers with discrimination information ≥ 0.001 bits for exons grouped by phylogenetic breadth of alternative splicing. 5mers associated with known splicing regulators are shown in color, with mean of all 5mers in black.
E) The fraction of introns containing MBNL1 CLIP-Seq clusters (19) was assessed in introns adjacent to exons with different phylogenetic patterns splicing, as in (A).
F) As in (E), but grouped by presence/absence of a MBNL1 motif. The mean fraction ± SEM of 1000 bootstrap samples is shown. *P < 0.01 (binomial test).
G) As in (E), but with exons sampled from each set to match the MBNL motif counts in the CQRM set. Mean ± SD of 1000 samplings is shown for the first 3 groups; observed mean is shown for the CQRM set. *P < 0.05, **P < 0.001.

