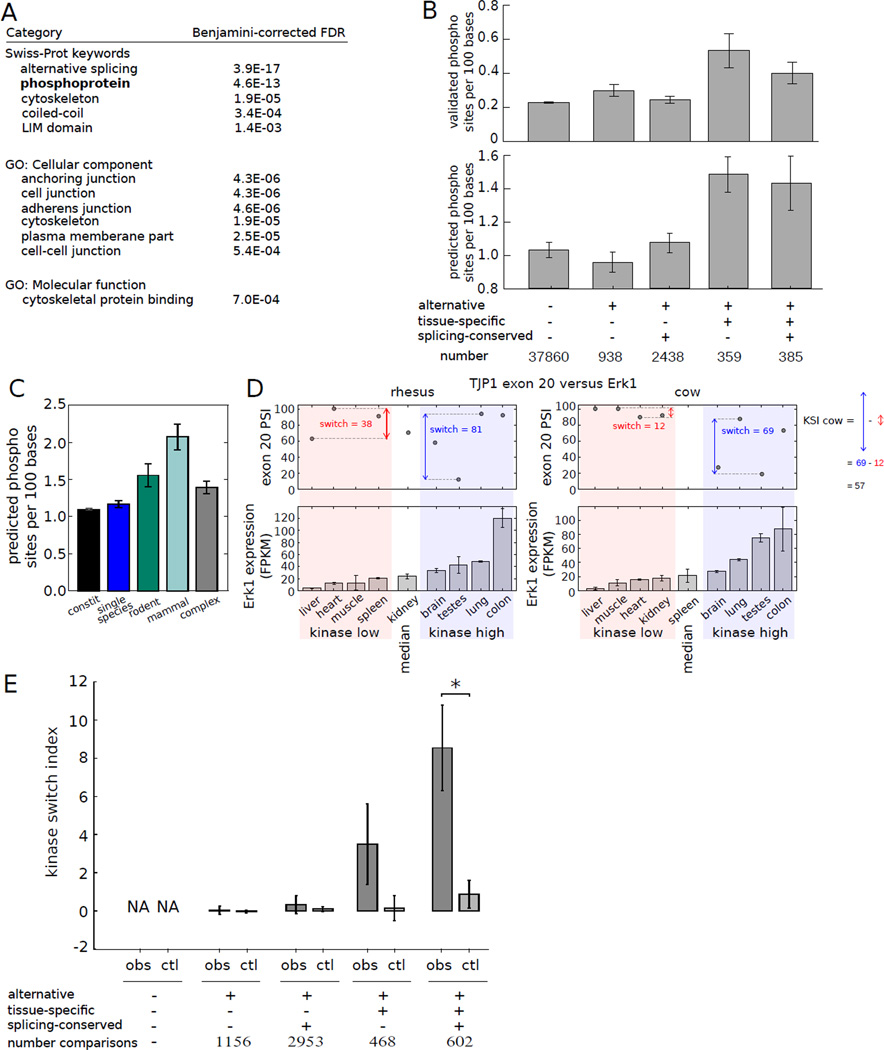
Figure 4. Alternative splicing delimits the scope of protein phosphorylation.
A) GO analysis of genes containing tissue-regulated exons whose splicing is conserved.
B) Density of Phosphosite phosphorylation sites (top) or Scansite predicted phosphorylation sites (bottom) in exons grouped by alternative splicing status, tissue-specificity and splicing pattern conservation (6). Mean ± SEM is shown.
C) Mean Scansite predicted phosphorylation site density in exons grouped by phylogenetic breadth of splicing.
D) TJP1 exon 20 splicing has a higher switch score in tissues where Erk1 is expressed above median levels (shaded blue) than where it is expressed below median (shaded pink); KSI is defined as the difference between these switch scores. PSI value not calculated if TJP1 expression fell below a cutoff (e.g., cow spleen).
E) Mean KSI values for kinase-exon pairs involving the sets of exons as in (B). Mean ± SEM is shown. Observed values (obs) were compared with controls in which PSI values in different tissues were randomly permuted (ctl). Comparisons marked (*) were significant by Mann-Whitney U test (P < 0.005).

