
Figure 1 (facing page). Specific Inhibition of CCL5- and CCL3-Induced Internalization of CCR5 and Inhibition of T-Cell Chemotaxis Associated with Maraviroc.
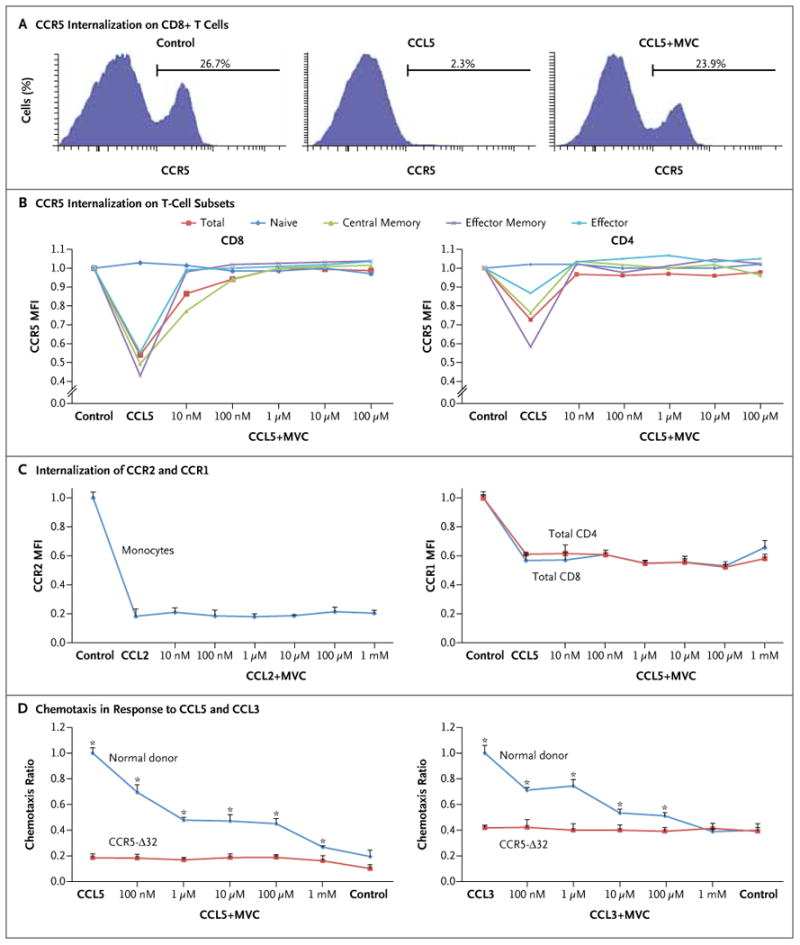
In Panel A, a representative flow-cytometric analysis shows a reduction in surface expression of CCR5 on normal donor CD8+ T cells after incubation with 100 nM of CCL5 for 30 minutes. Preincubation with 1 μM of maraviroc (MVC) for 30 minutes fully abrogated internalization of the receptor. Panel B shows the effect of various concentrations of maraviroc on CCL5-induced internalization of T cells. The mean fluorescence intensity (MFI) of CCR5 was measured by means of flow cytometry after incubation with escalating concentrations of maraviroc and then incubation with 100 nM of CCL5 or CCL3. The surface expression of CD4, CD8, CD45RA, and CCR7 was used to define T-cell subsets. Plots represent means of three different experiments. All T-cell subsets other than naive CD4+ and CD8+ cells showed a significant response to CCL5 and efficient inhibition by maraviroc (P<0.01 by analysis of variance for central memory, effector memory, and effector cells; P>0.05 for naive cells). Similar results were observed with CCL3 (not shown). Panel C shows the lack of effect of maraviroc on CCL5-induced internalization of CCR1 on T cells and CCL2-induced internalization of CCR2 on monocytes (P>0.05 by analysis of variance). Panel D shows the results of chemotaxis assays in the presence of escalating concentrations of maraviroc. Peripheral-blood mononuclear cells from five normal donors and from three donors who were homozygous for the CCR5 Δ32 allele (CCR5-Δ32) were preincubated with maraviroc and then allowed to migrate in a Boyden chamber in response to 100 nM of CCL5 (left panel) or 0.5 nM of CCL3 (right panel) for 3 hours. Migrating cells were stained with surface markers and counted by means of flow cytometry. Chemotaxis ratios represent the number of migrating cells in each experimental condition divided by the number of cells in the positive control sample (chemokine without maraviroc). Means and standard errors (represented by T bars) are shown. P values represent a two-sided t-test between normal donor cells and Δ32 cells for each condition. Asterisks indicate P<0.01.