
Figure 3 (facing page). Inhibition of CCL5-Induced CCR5 Internalization and CCL5-Induced T-Cell Chemotaxis by Serum from Patients Receiving Maraviroc.
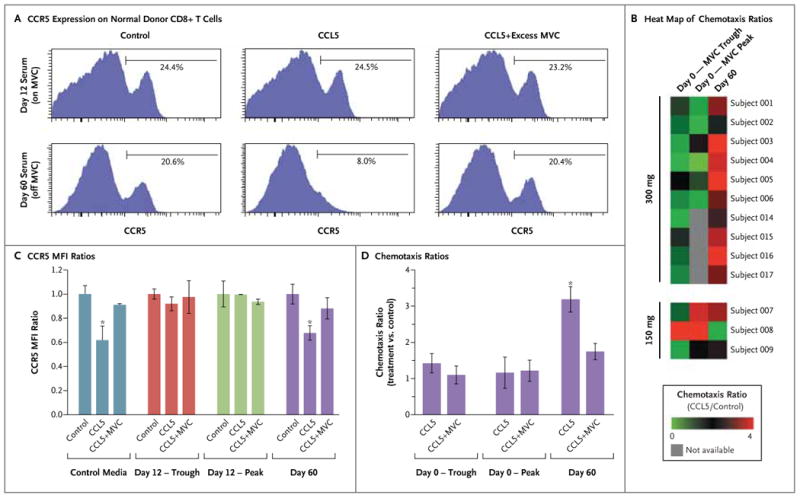
Panels A and C show the loss of responsiveness of CD8+ T cells to CCL5 after incubation with serum obtained from patients receiving maraviroc (MVC) at a dose of 300 mg twice daily on day 12 after transplantation; serum obtained on day 60 (30 days after the last dose of maraviroc) still allowed the cells to respond to CCL5. Panel A includes representative results on flow cytometry that show the expression of CCR5 on normal donor CD8+ T cells after incubation with serum for 1 hour and stimulation by 100 nM of CCL5, 100 nM of CCL5 plus excess maraviroc (1 mM), or control media. CCR5 internalization was reversed by adding excess maraviroc to the day 60 sample but not to the day 12 sample. Panel C shows the ratios of mean fluorescent intensities (MFI) of CCR5 on normal donor CD8+ T cells, expressed as the MFI ratio between each experimental condition and its media control. Serum obtained from six patients on day 12 at trough levels (before drug administration) or peak levels (3 or 4 hours after administration) abrogated the internalization of CCR5 by CCL5. Serum obtained on day 60 and control media did not have an inhibitory effect on the internalization of CCR5 by CCL5, which was efficiently blocked by adding excess maraviroc (1 mM). The asterisks indicate P<0.01 in a paired two-sided t-test. Similar results were seen with CD4+ cells. Panels B and D show the results of chemotaxis experiments in which normal donor peripheral-blood mononuclear cells were suspended for 1 hour in serum from patients obtained on day 0 (maraviroc trough or peak levels) and on day 60 (off maraviroc). The cells were then allowed to migrate in response to 100 nM of CCL5 or control media. Chemotaxis ratios represent the number of migrated CD3+ cells with CCL5 stimulation divided by the number of cells in the control sample. Panel B shows a heat map of chemotaxis ratios on day 0 and day 60, showing consistent inhibition of CCL5-induced chemotaxis in patients receiving maraviroc (at a dose of 300 mg twice daily). Panel D shows the chemotaxis ratios for the first six patients who received maraviroc, showing inhibition of CCL5-induced chemo-taxis at maraviroc peak and trough levels, as compared with those on day 60. The asterisk indicates P<0.01 in a paired two-sided t-test. The addition of 1 mM of maraviroc decreased the chemotaxis ratio only on day 60. The I bars indicate standard errors.