Figure 3.
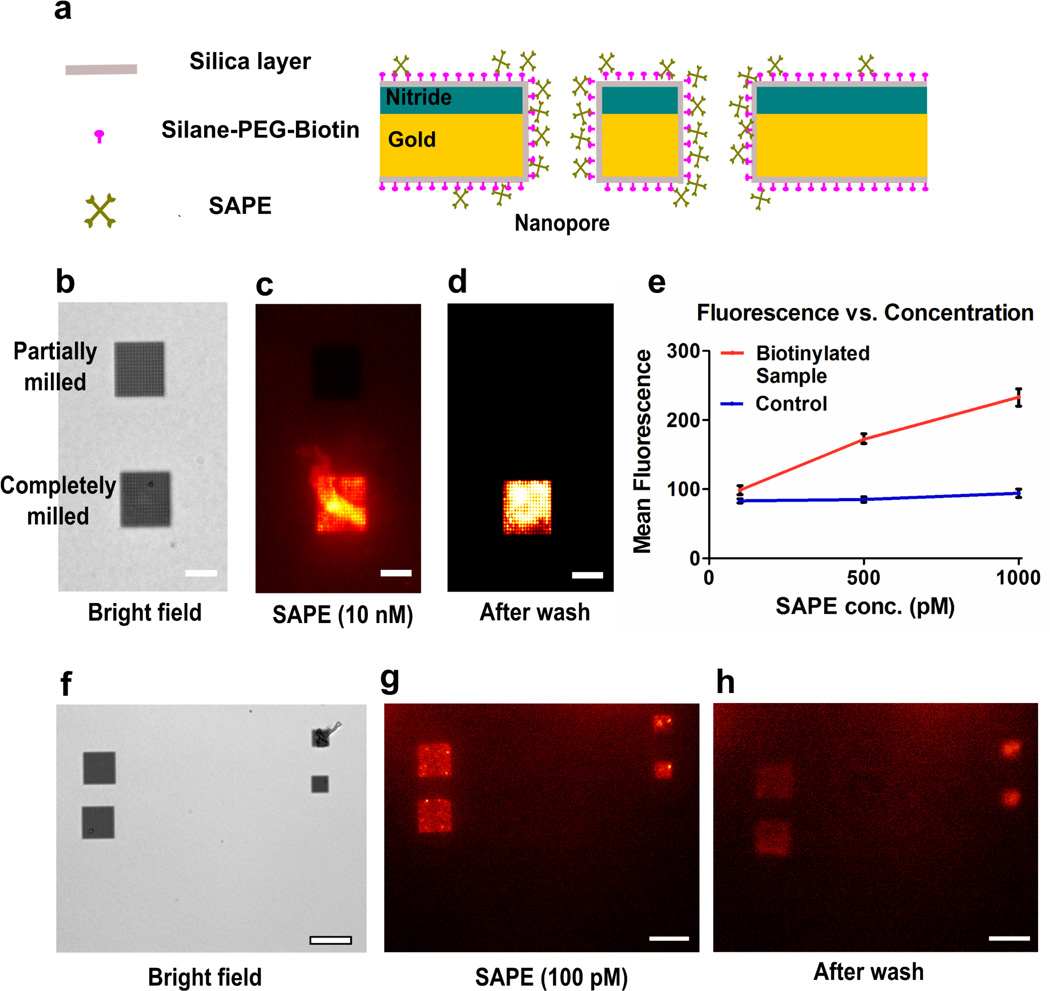
Schematic, flow dependence and low concentration analysis of SAPE-biotin binding. (a) Schematic showing all surfaces of the chip covered with silica and a monolayer of silane-PEG-biotin. SAPE is directed towards the nanopore arrays where it binds with the biotin. (b) Bright-field image of a suspended nitride region with one partially milled nanopore array and an array with completely milled pores. The arrays (16 µm × 16 µm) have a 600 nm pore diameter and 1 µm periodicity. Scale bar is 10 µm for (b–d). (c) Fluorescence image of the sample after addition of 10 nM SAPE solution demonstrating nanopore-induced pre-concentration. The partially milled pores are not open on the trans side of the chip and hence cannot act as capillaries. (d) Fluorescence image of the sample after rinsing the chip with DI water. (e) A graph showing linear relationship between the mean fluorescence over the nanopore arrays as a function of the concentration of SAPE. (f) Bright-field image of a suspended nitride region with 4 nanopore arrays. Larger arrays (16 µm × 16 µm) have a 600 nm pore diameter and 1 µm periodicity. Smaller arrays (8 µm × 8 µm) have a 200 nm pore diameter and 500 nm periodicity. (g) Fluorescence image of the sample after addition of 100 pM SAPE solution. (h) Fluorescence image of the area after rinsing the chip with DI water. Scale bar is 20 µm for (f–h).

