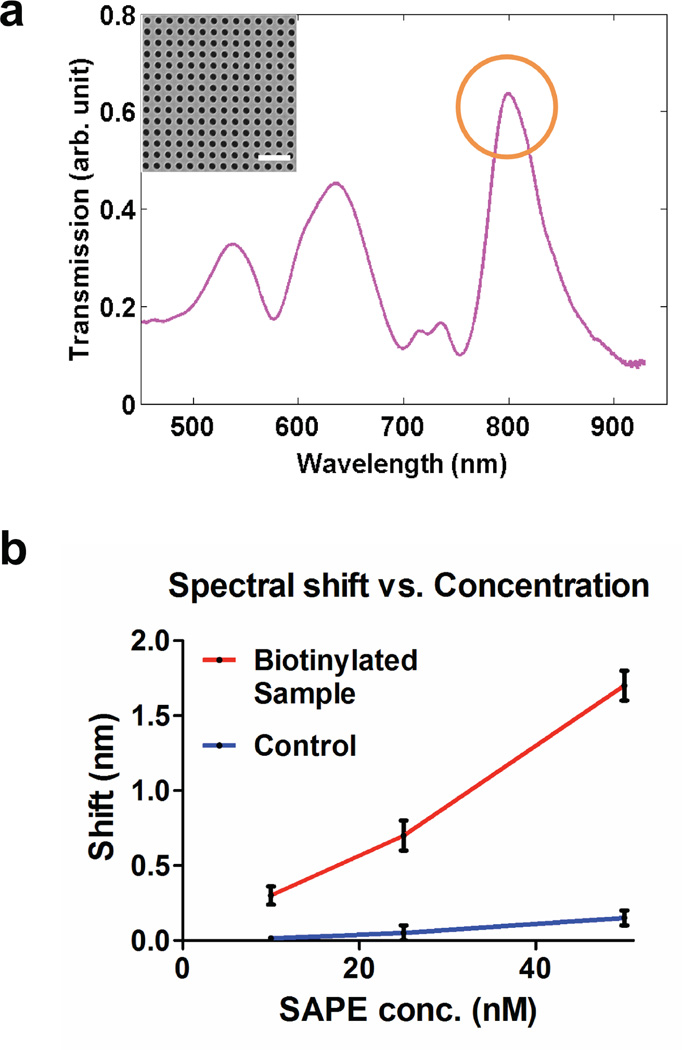
Figure 4.
Surface plasmon resonance detection of SAPE-biotin binding. (a) Normalized transmission spectra as recorded from an array of 200 nm nanopores. The transmission peak at approximately 800 nm corresponds to the gold-water interface and was used to measure the shift in transmission. (Inset) SEM image of nanopores (diameter: 200 nm, periodicity: 500 nm) used for spectral measurements. Scale bar is 1.5 µm. Four arrays were milled on the suspended nitride area for measuring the transmission spectra, two large (16 µm × 16 µm) and two smaller (8 µm × 8 µm). (b) A graph showing shift of transmission spectra through the nanopore arrays upon SAPE binding as a function of SAPE concentration.

