

Abstract
OBJECTIVES
An early event in the pathogenesis of gastroesophageal reflux disease (GERD) is an acid-induced increase in junctional (paracellular) permeability in esophageal epithelium (EE). The molecular events that account for this change are unknown. E-cadherin is a junctional protein important in barrier function in EE. Therefore, defects in barrier function in EE were sought in GERD as well as whether their presence correlated with abnormalities in e-cadherin.
METHODS
Endoscopic biopsies of EE from GERD (n = 20; male 10; female 10; mean age 50 ± 10 years) and subjects with a healthy esophagus (controls; n = 23; male 11; female 12; mean age 51 ± 11 years) were evaluated in mini-Ussing chambers and by western blot and immunochemistry; and serum analyzed by enzyme-linked immunosorbent assay (ELISA). A role for e-cadherin was also assessed using a unique conditional knockout of e-cadherin in adult mouse esophagus.
RESULTS
EE from GERD patients had lower electrical resistance and higher fluorescein flux than EE from controls; and the findings in GERD associated with cleavage of e-cadherin. Cleavage of e-cadherin in GERD was documented in EE by the presence of a 35-kDa, C-terminal fragment of the molecule on western blot and by an increase in soluble N-terminal fragments of the molecule in serum. Activation of the membrane metalloproteinase, A Disintegrin And Metalloproteinase (ADAM-10), was identified as a likely cause for cleavage of e-cadherin by western blot and immunostaining and a role for e-cadherin in the increased junctional permeability in EE from GERD supported by showing increased permeability after deletion of e-cadherin in mouse EE.
CONCLUSIONS
The EE in GERD has increased junctional permeability and this is in association with proteolytic cleavage of e-cadherin. As loss of e-cadherin can, alone, account for the increase in junctional permeability, cleavage of e-cadherin likely represents a critical molecular event in the pathogenesis of GERD, and identification of cleaved fragments may, if confirmed in larger studies, be valuable as a biomarker of GERD.
INTRODUCTION
The commonest manifestation of gastroesophageal reflux disease (GERD) is the symptom of heartburn, a reflection of acid damage to the esophageal epithelium (EE) (1). Based on the rabbit model, an early marker of acid damage to EE is an increase in junctional (paracellular) permeability (2–6). This is evident in intact EE and before development of erosions by findings of low esophageal transmural electrical potential difference (PD) and resistance (RT) and increased transmural flux of cell-impermeant markers, e.g., mannitol, fluorescein, and fluorescein-labeled dextrans. Moreover, this increase in junctional permeability in the rabbit model was correlated morphologically with the presence of dilated intercellular spaces (DIS) in EE (2,3,5). That the pathogenesis of reflux damage to the EE in GERD mirrors the findings in acid-damaged EE in the rabbit model is supported by the following: (i) low basal esophageal PD in patients with GERD in vivo (7), (ii) induction of a low esophageal PD and heartburn in patients with non-erosive reflux disease during acid perfusion (8); (iii) development of DIS in EE in healthy subjects during acid perfusion (9,10); (iv) presence of DIS in EE in both erosive esophagitis and non-erosive reflux disease (11–15); and (v) restoration of DIS in EE to normal (along with control of heartburn) by treatment with proton pump inhibitors (16,17). Since, as in the rabbit model, these observations support the likelihood that there is an increase in paracellular permeability in EE of GERD patients, we sought to identify any structural defects in those proteins involved in control junctional barrier function in EE.
E-cadherin is a component of the adherens junction, a structure along with the tight junction and desmosomes that are known to be important in junctional barrier function in most epithelia, including that of the esophagus (18–21). E-cadherin is a single-span, transmembrane protein whose carboxy (C)-terminus resides in the cytoplasm and whose amino (N)-terminus resides in the intercellular space. The N-terminus of e-cadherin molecules from membranes of adjacent cells form a barrier by calcium-dependent binding to each other within the intercellular space. As the protein bridges of e-cadherin both encircle the cell membrane and support the adhesion of the bridging proteins (occludin and claudins) forming the tight junction, they have an integral role in establishing junctional (electrical) resistance and controlling junctional permeability. This role for e-cadherin in (rabbit) EE has recently been shown in the Ussing chamber using the calcium-switch technique (19). This technique reveals that removing bathing solution calcium lowers RT and restoring calcium returns RT to baseline; however, this return of RT to baseline after restoration of calcium can be prevented in EE by exposure to antibodies (or short peptides) to the extracellular, but not intracellular, domain of e-cadherin. These results support a role for e-cadherin in the junctional barrier in EE and suggest that any increase in junctional permeability in the EE in GERD may be accounted for by disruption in its bridge formation. Therefore, endoscopic biopsies of EE from GERD and those with healthy esophagus were obtained for characterization of junctional barrier function and correlation of any defects with changes in e-cadherin.
METHODS
Human subjects
All subjects were adults, aged 18–75 years old, which were undergoing endoscopy for clinical reasons. Biopsies were obtained of grossly normal appearing mucosa from the lower 5-cm of esophagus using jumbo forceps (Radial Jaw-3 Maximum Capacity, Boston Scientific, Natick, MA). Subjects with symptomatic GERD (n = 20; male 10; female 10; mean age 50± 10 years) had a history of heartburn in association with typical esophageal erosions (erosive esophagitis) or a history of heartburn and either pathologic acid exposure on 24h pH monitoring or positive response to proton pump inhibitor therapy. Control subjects with a healthy esophagus (n = 23; male 11; female 12; mean age 51± 11 years) had neither history of esophageal symptoms (heartburn, regurgitation, dysphagia, and odynophagia) nor endoscopic signs of esophageal disease. Exclusion criteria for both groups were Barrett’s esophagus, peptic stricture, or other esophageal disease, e.g., eosinophilic esophagitis, esophageal varices, esophageal cancer; bleeding disorder, active gastrointestinal bleeding, gastric malignancy, severe heart–lung–liver–renal–cerebrovascular disease or post-transplant of any type. Blood samples were obtained by venipuncture using a red top tube without preservatives. All patients provided written, informed consent for these procedures, and the study was approved by the Human Research Ethics Committee of University of North Carolina at Chapel Hill.
Mini-Ussing chamber
Biopsies for chamber studies were immersed in ice-cold oxygenated-Ringer’s solution and immediately transported to the laboratory for mounting mucosal side up in mini-Ussing chambers as previously described (22). These chambers have Lucite rings whose aperture is 2mm in diameter and whose square area is 0.0314 cm2 Biopsies were bathed on both sides with 5 ml of normal Ringer’s solution (composition in mmol/l): Na+ 140, Cl− 119.8, K+ 5.2, HCO3− 25, Ca2+ 1.2, Mg2+ 1.2, HPO42− 2.4, H2PO4− 0.4, 268 mosmol/kgH2O, pH 7.4 when gassed with 95% O2–5% CO2 at 37°C. Two sets of electrodes connected the solutions in the chamber to voltage clamps (Voltage Current Clamp, MC6; Physiologic Instruments, San Diego, CA) that permitted the direct recording of the transmural electrical PD and determination of short-circuit current (Isc) by passage of current. (Note: Isc is recorded in μA/cm2 and converted to μeq/cm2/h by multiplying 0.0373.) Total electrical resistance (RT) was calculated using Ohm’s law, where PD = Isc× RT. All experiments were conducted under open-circuit conditions except when periodically switched to the short-circuit state for recording of Isc. The n value for each experiment represents the values obtained from one tissue per subject. After equilibration for 30 min, basal electrical readings of PD, Isc, and RT were obtained.
Transmucosal flux
The flux of fluorescein, 300 MW (Sigma, St Louis, MO) was determined by adding 1 mm fluorescein to the luminal bath. After mixing, the luminal bath was sampled to obtain the initial fluorescein concentration. The serosal bath was sampled at zero time before fluorescein addition to the luminal bath and at periodic intervals following the addition of fluorescein to the luminal bath. Fluorescein levels in samples were determined by measuring sample fluorescence using a fluorometer (Turner Biosystems, TBS-380 Amico SPF 500, Sunnyvale, CA). The flux was calculated as a percent of the luminal fluorescein concentration by dividing serosal fluorescein levels by the luminal fluorescein concentration × 100. Note: the values for fluorescein recorded yield fluorescence values that are linear over the recorded range.
Immunofluorescence and western blotting
Methods for western blotting, immunofluorescence, and digital image processing were previously described by Jovov et al. (23). Antibodies against the intracellular carboxy (C)-terminus and extracellular N-terminus of human e-cadherin (Catalog # 33-4000 and # 13-1700); and antibodies against mouse e-cadherin (Catalog # 13-1900) were purchased from Zymed Laboratories (San Francisco, CA). E-cadherin C-terminus antibodies were used for western blot; and N-terminus antibodies were used for immunolocalization and enzyme-linked immunosorbent assay (ELISA). Antibodies against the C-terminus of A Disintegrin And Metalloproteinase (ADAM-10) were purchased from Millipore (Catalog # AB19026; Billerica, MA). Monoclonal anti-β actin antibodies were from Santa Cruz Biotechnology (Catalog # sc-47778: Santa Cruz, CA). Secondary antibodies for western blots were goat anti-rabbit IRDye 800 (Rockland, Gilbertsville, PA) and goat anti-mouse Alexa 680 (Molecular Probes, Carlsbad, CA). Signals were detected using an Odyssey Infrared Imaging System (LI-COR, Lincoln, NE).
Enzyme-linked immunosorbent assay
Soluble (N-terminus) e-cadherin levels were measured in serum using a commercially available sandwich ELISA kit (Invitrogen, Carlsbad, CA). In brief, a monoclonal antibody to e-cadherin is coated onto microtiter plates. Samples containing an unknown amount of e-cadherin are incubated in the wells at 37°C for 2h. A second, detecting, monoclonal antibody (conjugated with peroxidase) is incubated in the wells at 37°C for 1h. Peroxidase substrate solution (H2O2 and tetramethylbenzidine) is added and results in a color change. The reaction is terminated by the addition of 1M H2SO4 and absorbance of the sample measured using a FLUO star Omega Multidetection Microplate Reader (BMG LABTECH, Cary, NC) at 450 nm. Each sample is measured twice and the average value used for determination of e-cadherin concentration from a standard curve plotted using values obtained from standard solutions provided with the kit.
Deletion of e-cadherin in adult mouse esophagus
The mouse line with an e-cadherinflox allele was derived by Boussadia (24) and maintained on a C57Bl/6 genetic background. No abnormal phenotype was observed in unrecombined homo zygotes at any stage. To establish the keratin5 promoter driving CreER (KRT5-CreERT) transgenic mouse line, DNA was injected into fertilized zygotes. Offspring of 11 founders were screened to obtain two lines, one of which has expression in both trachea and esophageal basal cells (25) and the other that has expression in esophageal basal cells but not in tracheal cells. This second line, presently on the N3 backcross to C57BL/6, was used for current experiments. For adult lineage tracing, 8–10-week-old mice hemizygous for KRT5-CreERT and homozygous for R26R were injected intraperitoneally one time or four times every other day with Tamoxifen (Tmx), 0.25 mg/g body weight, in Mazola corn oil (ACH Food Companies, Memphis, TN). To delete e-cadherin four Tmx injection were performed every other day on KRT5-CreERT;e-cadherinflox/flox compound mutants and KRT5-CreERT;E-cadherinflox/+ control mice (Figure 1). Five days after the final tamoxifen injection, the esophagi, n = 10, were harvested, divided into three portions, and processed as follows: one section for fixation in 4 % paraformaldehyde for immunohistochemistry, one section for fixation in RNA-Later for RNA extraction and quantitative reverse transcriptase-PCR (qRT-PCR — see below), and one section placed in oxygenated-Ringer’s solution for mounting in mini-Ussing chambers and performance of fluorescein flux as described for human EE above. Xgal staining was performed as previously described (26,27).
Figure 1.

The CreER/LoxP system. CreER is a tamoxifen-inducible Cre recombinase fused to the estrogen receptor (ER). In the current studies, expression of CreER fusion gene is driven by an esophageal basal cell-specific promoter, Krt5. When tamoxifen binds to CreER protein, CreER translocates into the nucleus, and then mediates site-specific recombination (deletion of e-cadherin).
Real-time PCR
RT-PCR was performed using previously described methods (28). In brief esophageal epithelial tissue underwent total RNA isolation using RNeasy kits (Qiagen, Valencia, CA) per the manufacturer’s recommended protocols. RNA was treated with TURBO DNase (TURBO DNA-free kit, Ambion, Austin, TX) to remove contamination by genomic DNA. cDNA was synthesized from 2.5 μg of treated RNA for each cell culture sample using Superscript III reverse transcriptase (Invitrogen) with an equal amount of RNA included in an No-RT control for each separate RNA sample. Real-time PCR primers used in this study were validated primer sets (QuantiTect Primers Assays, Qiagen). Amplification was performed in a Rotor-Gene 3000 (Corbett Research, Mortlake, Australia) thermal cycler at 95°C for 3 min followed by 37 cycles of 94°C for 15 s, 54°C for 20 s, and 72°C for 25 s. Following amplification, a melting curve analysis was performed by heating the reactions from 50 to 99°C in 0.2°C intervals while monitoring fluorescence. The cycle at which each sample crossed a fluorescence threshold, Ct, was determined and triplicate values for each cDNA averaged.
Data analysis
Data are reported as the mean ± s.e.; and statistical significance determined by Student’s t-test for paired and unpaired samples at the P < 0.05 level.
RESULTS
Junctional permeability is increased in GERD
Biopsies of intact EE from GERD in mini-Ussing chambers revealed at equilibrium baseline values for RT that were significantly lower than those in controls (Figure 2a). Further, transmucosal fluorescein fluxes performed on the same tissues over a 2-h period yielded significantly higher fluxes in GERD than in controls (Figure 2b). Both of these values are compatible with the EE in GERD having an increase in junctional permeability over that of healthy EE.
Figure 2.

Permeability of esophageal epithelium in control and GERD patients. (a) Basal transepithelial electrical resistance (RT) and (b) mucosal-to- serosal fluorescein fluxes are shown for the esophageal epithelium (EE) from patients with gastroesophageal reflux disease (GERD) and from subjects with a healthy esophagus (controls). Values were obtained for EE by mounting endoscopic biopsies in mini-Ussing chambers while bathed by normal Ringer on both sides. The mean basal R T from GERD, n = 11, is significantly lower than from controls, n = 13 while mean fluorescein flux from GERD, n = 9, is significantly higher than from controls, n = 10. Values are mean values ± s.e., P < 0.05 vs. controls.
E-cadherin is cleaved in EE from GERD patients
Western blots performed on EE from healthy controls using antibody to the C-terminus of e-cadherin revealed in all subjects a single 120-kDa band compatible with an intact molecule. In contrast, the blots performed on EE from all subjects with GERD yielded two bands, one at 120 kDa and one at 35 kDa. The presence of the C-terminal band at lower molecular weight indicates that in GERD some molecules of e-cadherin had been cleaved (Figure 3). Notably, the size of the C-terminal fragment, 35 kDa, indicated that e-cadherin was likely cleaved near the extracellular membrane, and one candidate for this is the membrane metalloproteinase ADAM-10.
Figure 3.

Western blots of e-cadherin are shown for esophageal epithelium (EE) from patients with gastroesophageal reflux disease (GERD) and from subjects with a healthy esophagus (controls). Ten micrograms of protein are loaded in each lane and immunostaining for e-cadherin performed with a monoclonal antibody to a C-terminal epitope of human e-cadherin. Note that in control EE, there is a single band at 120 kDa (full length, FL) while in GERD there are two bands, one at 120 kDa and a second at ~ 35 kDa (C terminal fragment 1, CTF1). This immunoblot is representative of six separate experiments performed using EE from different subjects: blot was probed with actin as a loading control.
Immunostaining for e-cadherin using the N-terminus antibody in healthy EE of controls demonstrated that e-cadherin was localized to the membranes of cells throughout all layers (Figure 4, left upper panel). Immunostaining for ADAM-10 documented its presence in healthy EE and showed that it colocalized with e-cadherin (Figure 4, middle and right upper panel). In contrast, immunostaining for ADAM-10 in EE from GERD showed that e-cadherin was absent from those areas of EE in which ADAM-10 was highly expressed (Figure 4, lower panels). As the lack of colocalization of ADAM-10 and e-cadherin in GERD suggested that e-cadherin may have been cleaved by an “active” form of ADAM-10 and so depleted from those sites, “active” ADAM-10 was sought on western blots (Figure 5). Healthy EE exhibited two bands for ADAM-10, one band at 85 kDa compatible with inactive ADAM-10 and a much less dense band at 60 kDa representing an “active” form of the molecule. Notably, the EE from GERD was devoid of the larger 85 kDa band reflecting the inactive form while it exhibited a single dense band at 60 kDa. This indicated that all of the ADAM-10 in EE from GERD was in the active form.
Figure 4.

E-cadherin and A Disintegrin And Metalloproteinase (ADAM-10) expression in healthy esophageal epithelium (EE) and gastroesophageal reflux disease (GERD) patients. In normal EE, E-cadherin and ADAM-10 stained membrane in all layers of epithelium. ADAM-10 staining is stronger in basal layer and faint in upper layers. Colocalization of two proteins was present in all layers, but most prominent in basal layer of EE. In GERD patients, E-cadherin and ADAM-10 show reciprocal intensity of staining for ADAM-10 and E-cadherin (when E-cadherin is strong ADAM-10 is faint and vice versa) suggesting cleavage (depletion) of e-cadherin by ADAM10.
Figure 5.

Western blot of A Disintegrin And Metalloproteinase (ADAM-10) is shown for esophageal epithelium (EE) from patients with gastroesophageal reflux disease (GERD) and from subjects with a healthy esophagus (controls). Ten micrograms of protein are loaded in each lane and immunodetection for ADAM-10 performed with a C-terminus antibody. Note that in control EE, there are two bands for ADAM-10, representing the 85 kDa intact molecule and a smaller 60-kDa band representing the active form of the molecule. In the EE from GERD, only the smaller active form of ADAM- 10 is identified. The blot was probed with actin as a loading control. This blot is representative of six separate experiments.
N-terminal fragments of cleaved e-cadherin are increased in serum of GERD patients
Cleavage of e-cadherin in EE from GERD results in loss of the N-terminal fragment of the molecule. As the N-terminal fragment of e-cadherin is known to be soluble (29), we sought its presence in serum. Consistent with the finding of C-terminal fragments of e-cadherin in EE from GERD, serum levels of the N-terminal fragment were found to be significantly higher than that present in the serum of healthy controls (Figure 6). Indeed, from Figure 5 a serum value > 1.6 μg/ml was observed to have a sensitivity of 90% and specificity of 100 % for differentiating between healthy subjects and those with GERD.
Figure 6.

Enzyme-linked immunosorbent assay (ELISA) using an N- terminal antibody to e-cadherin illustrates the quantity of soluble fragments of e-cadherin in serum of patients with GERD (n = 9) and in serum of subjects with healthy esophagus (controls; n = 10). Significantly more N-terminal fragments are shown to be present in the serum in GERD. * P < 0.05.
Conditional deletion of e-cadherin in mouse esophagus increases junctional permeability
The data above indicate that the EE from GERD has increased junctional permeability and this in association with cleavage of e-cadherin. To help establish a cause-and-effect relationship between cleaved e-cadherin and junctional permeability, we developed a unique model in which e-cadherin was conditionally deleted from the adult mouse EE. This was done using a KRT5-CreERT mouse line in which a 6-kb human keratin 5 (KRT5) promoter was used to drive the expression of CreER fusion protein (Figure 1). (Note: we also tried the previously published Krt14-CreER transgenic line derived by Vasioukhin et al. (1999), but no Cre recombinase activity was detected in the esophagus of adult Krt14-CreER;R26R mouse after multiple Tmx injections — data not shown. This indicates that this represents the first such deletion of e-cadherin from the adult mouse esophagus.) Recombination occurred in basal cells of the KRT5-CreER;R26R EE 24h after Tmx injection (Figure 7a). Seven days after a single dose of Tmx, ~ 10 % of basal cells and their derivatives were positive for Xgal staining, suggesting that the hKRT5 promoter activity recapitulated the endogenous keratin 5 expression pattern (Figure 7b). Further, after four Tmx injections, recombination occurred in 85 % of basal cells in the KRT5-CreER;R26R EE (Figure 7c). Following the generation of KRT5-CreER;e-cadherinflox/flox (E-cadΔ/Δ) compound mutants and 5 days after performance of the last of four Tmx injections, little to no e-cadherin was detectable by qRT-PCR (Figure 7d) or by immunostaining in the adult mouse EE (Figure 7e). Consistent with an increase in junctional permeability, the EE with deleted e-cadherin had DIS on EM (Figure 8) and significantly higher fluorescein flux than the EE from (untreated) littermate controls (Figure 7f). (Note: Tmx injections alone in healthy mice have no effect on e-cadherin or fluorescein flux in EE.)
Figure 7.
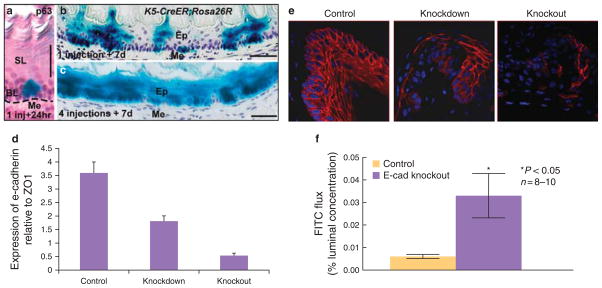
Effectiveness of genetic recombination in K5-CreER;Rosa26R adult mouse esophagus. (a) Xgal + ve cells are only located in p63 + ve basal cells 24 h after single injection of Tmx, 300 μg/g of body weight; (b) 7 days after a single injection, trails of Xgal + ve cells cross the epithelial layer; (c) 7 days after the final of four injections, 85 % of esophageal epithelial cells are Xgal + ve. SL, suprabasal layer; BL, basal layer; Me, Mesenchyme; Ep, epithelium. Scale bar: 50 μm. (d) Quantitative RT-PCR for e-cadherin in adult mouse esophageal epithelium (EE). E-cadherin expression was measured 1 and 2 weeks after induction of gene deletion by tamoxifen. Results are expressed as percentage of ZO1 expression. (e) Immunolocalization in mouse EE for littermates (control), partial deletion model, and full deletion model. Control panel demonstrates e-cadherin is localized to cell membranes of all layers while middle panel shows uneven staining of e-cadherin after partial deletion (7 days after tamoxifen injection) and right panel shows almost complete deletion at 2 weeks after tamoxifen induction. (f) Mucosal-to-serosal fluorescein (FITC) flux in control EE and EE from the esophagus with complete deletion of e-cadherin. Values are mean values ± s.e. * P < 0.05; n = 8 – 10.
Figure 8.
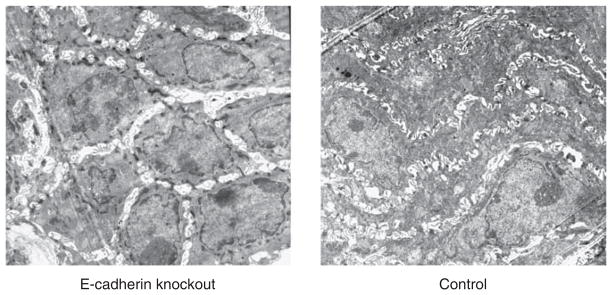
Electron photomicrographs from the lower esophagus of a mouse with complete deletion of e-cadherin and from its normal (control) littermate. Note: the presence of dilated intercellular spaces in the mouse with deletion of e-cadherin. Magnification: × 3,000.
DISCUSSION
The results of this investigation extend the parallels between the rabbit model of acid injury to EE and the damage observed in human EE in GERD. This was done by showing that, like the rabbit model, non-erosive EE from GERD patients have lower RT and higher fluorescein flux than healthy EE. As fluorescein is impermeant to (viable) cells and RT a sensitive marker of junctional integrity, these findings indicate that non-erosive EE in GERD have an increase in paracellular permeability. Moreover, we found that this increase in paracellular permeability in GERD was associated with cleavage of e-cadherin, the latter shown by the presence of two C-terminal bands in EE from GERD on western blot. As illustrated in the diagram (Figure 9), the larger 120-kDa band represented intact e-cadherin and the 35-kDa C-terminal band reflected a smaller, cleaved segment of e-cadherin. Consistent with cleavage of the N-terminal segment of e-cadherin in EE from GERD, the serum from GERD patients had higher amounts of soluble N-terminal fragments of e-cadherin than did healthy subjects. (Note: although the number of patients are small, subgroup analysis revealed no difference in e-cadherin proteolytic processing for C-terminal fragments on western blot and quantity of N-terminal fragments of e-cadherin on ELISA between erosive and non-erosive GERD patients.) That healthy subjects have a measurable amount of N-terminal fragments of e-cadherin in serum reflects the fact that cleavage of e-cadherin is a physiologic process, reflecting cell turnover in such tissues as skin and kidney. Indeed, the phenomenon by which e-cadherin is cleaved has been studied and is known as regulated intramembrane proteolysis (RIP) or RIPing (30). RIPing occurs by activation of a set of proteolytic enzymes that cleave e-cadherin in stepwise manner into ever smaller C-terminal fragments. As a result of cleavage, the extracellular (soluble) N-terminal fragment of e-cadherin is known to be jettisoned and absorbed into the blood stream (29,31–33). Further, an increase in soluble e-cadherin, as observed in GERD, has been reported in other diseases, particularly malignancies such as melanoma and gastric, colon, prostate, bladder and lung cancer, and inflammatory diseases of the skin, e.g., psoriasis, pemphigus vulgaris, eczema, atopic dermatitis, and Darier’s disease.
Figure 9.

Schematic representation of regulated intramembrane proteolysis (RIP) of e-cadherin. The e-cadherin molecule contains an extracellular N-terminal domain, transmembrane (TM) domain, and cytoplasmic C- terminal domain. Sequential cleavage of e-cadherin occurs by RIPing, starting with a membrane metalloproteinase (MP) cleaving the extracellular domain (N terminal fragment, NTF), then followed by a membrane γ-secretase cleaving C terminal fragment (CTF), within the membrane and finally by intracellular cleavage by cytosolic caspases, typically caspase-3. Notably, the cleaved extracellular N-terminal domain is soluble, diffuses into the blood stream and so can be measured in serum.
Based on the 35-kDa size of the C-terminal fragment identified in the EE from GERD, cleavage occurs close to the extracellular portion of the cell membrane — a site compatible with proteolysis by a membrane metalloproteinase (34–36) (Figure 9). In the present study, we identified ADAM-10 as a membrane metalloproteinase in human EE. Moreover, in the EE from GERD we found on western blot that ADAM-10 was only present in its smaller and so active form. That ADAM-10 in EE from GERD was in active form was also supported on immunostaining by the lack of colocalization of ADAM-10 with e-cadherin. This supports the likelihood that e-cadherin was cleaved by ADAM-10 and so lost from its membrane location. Loss of e-cadherin from its membrane location in EE from GERD patients was further supported by the increased amounts of N-terminal fragments of e-cadherin present in the serum of GERD patients. Indeed, if verified in larger numbers of subjects, the high sensitivity and specificity for identification of C-terminal fragments in EE (100 % sensitivity and 100 % specificity) and higher level of N-terminal fragments in sera (90 % sensitivity and 100% specificity) from GERD compared with healthy subjects suggests their potential use as biomarkers for the diagnosis of GERD.
Based on the process of RIPing, cleavage of e-cadherin by membrane metalloproteinases, e.g., ADAM-10, is followed sequentially by proteolytic cleavage of the C-terminal fragment by a membrane γ-secretase and then by cytosolic caspases, typically caspase-3. Notably, each of these subsequent enzymatic actions, cleave the C-terminal fragment of e-cadherin into ever smaller components (37–39) (Figure 9), molecules whose sizes were not identified on the western blots of EE from GERD patients in the present study. One reason for this may have been the observed low expression levels of γ-secretase on qRT-PCR present in EE from GERD patients (data not shown).
The major contributors to the junctional barrier in epithelia are the claudin-dominated tight junction and e-cadherin-dominated adherens junction (18,40). These structures encircle the cell membrane to create a barrier to the paracellular diffusion of ions and molecules. Although it is well recognized that the more apically oriented tight junction is the limiting pathway in healthy epithelia, it is also recognized that its normal functioning requires an intact adherens junction (18,40). Thus, if luminal acidity disrupts the adherens junction, through for instance the activation of ADAM-10 and its subsequent cleavage of e-cadherin, the predicted result would be increased junctional permeability due to loss of adhesion by e-cadherin. To test the hypothesis that loss of adhesion by e-cadherin could account for the observed increase in paracellular permeability in EE from GERD patients, we generated a mouse model in which e-cadherin was deleted from the EE. Notably, it showed that deletion of e-cadherin resulted in DIS and a marked increase in paracellular (junctional) permeability. This indicates that loss of adhesion by e-cadherin can itself result in DIS and the increase in junctional permeability observed in the EE from GERD patients. Moreover, since increased junctional permeability has been hypothesized to be an important link to the symptoms (heartburn) and signs (erosions) in GERD (41,42), the identification of cleavage of e-cadherin in this report likely represents an important, if not critical, molecular event in the pathogenesis of GERD. Further, and supporting the potential extension of this observation to the clinic, preliminary data indicate that patients with eosinophilic esophagitis, a condition also associated with DIS, lack cleavage of e-cadherin in EE (43). Since at times it is clinically and morphologically difficult to distinguish between eosinophilic esophagitis and GERD (44–46), the presence of C-terminal fragments of e-cadherin in biopsies of EE may prove to be of value as a biomarker of GERD. Clearly, much work needs to be done to confirm these intriguing observations.
Study Highlights.
WHAT IS CURRENT KNOWLEDGE
The esophageal epithelium (EE) in gastroesophageal reflux disease (GERD) is characterized histopathologically by dilated intercellular spaces (DIS) and, based on the rabbit model of acid injury, this suggests the presence of an increase in paracellular permeability.
The cause for the DIS representing an increase in paracellular permeability in EE in GERD is unknown.
WHAT IS NEW HERE
The esophageal epithelium (EE) in gastroesophageal reflux disease (GERD) has increased paracellular permeability.
This increase in paracellular permeability is in part due to loss of adhesion by e-cadherin.
Loss of adhesion by e-cadherin in EE in GERD results from its proteolytic cleavage by a membrane metalloproteinase, ADAM-10.
The C-terminal fragments of e-cadherin in esophageal biopsies and N-terminal fragments of e-cadherin in serum have the potential to serve as biomarkers for the diagnosis of GERD.
Acknowledgments
Financial support: This work was supported by NIH grants HL071303, K99/R00(DK082650-01), and DK 036013.
Footnotes
Guarantor of the article: Roy C. Orlando, MD.
Specific author contributions: Involved in all aspects of this study from experimental design to ms writing: Biljana Jovov, Roy C. Orlando, and Nelia A. Tobey; design and performed study on e-cadherin conditional knockout model: Jianwen Que and Brigid L.M. Hogan; provided technical help and contributed to data collection and analysis: Zorka Djukic.
Potential competing interests: Roy C. Orlando has received research support from Takeda, AstraZeneca, and Proctor & Gamble Pharmaceuticals; Active Grant support: Astra Zeneca: Does Intercellular Space Diameter in Esophageal Epithelium Distinguish between PPI-responsive and PPI-refractory subjects with Heartburn? Takeda Pharmaceutical: Can detection of fragments of cleaved E-cadherin in tissue and/or blood be of value for identifying and monitoring patients with PPI-responsive heartburn? Provisional patent for GERD biomarker: Biljana Jovov, Roy C. Orlando, Nelia A. Tobey, and Zorka Djukic.
References
- 1.Orlando RC. Reflux esophagitis. In: Yamada T, Alpers D, Owyang C, Powell DW, ESF, editors. Textbook of Gastroenterology. Lippincott Company; Philadelphia: 1995. pp. 1214–42. [Google Scholar]
- 2.Tobey NA, Hosseini SS, Argote CM, et al. Dilated intercellular spaces and shunt permeability in nonerosive acid-damaged esophageal epithelium. Am J Gastroenterol. 2004;99:13–22. doi: 10.1046/j.1572-0241.2003.04018.x. [DOI] [PubMed] [Google Scholar]
- 3.Orlando RC, Powell DW, Carney CN. Pathophysiology of acute acid injury in rabbit esophageal epithelium. J Clin Invest. 1981;68:286–93. doi: 10.1172/JCI110246. [DOI] [PMC free article] [PubMed] [Google Scholar]
- 4.Orlando RC. Pathophysiology of gastroesophageal reflux disease: esophageal epithelial resistance. In: Castell DO, Richter JE, editors. The Esophagus. 4. Lippincott Williams & Wilkins; Philadelphia: 2004. pp. 421–33. [Google Scholar]
- 5.Carney CN, Orlando RC, Powell DW, et al. Morphologic alterations in early acid-induced epithelial injury of the rabbit esophagus. Lab Invest. 1981;45:198–208. [PubMed] [Google Scholar]
- 6.Orlando RC, Bryson JC, Powell DW. Mechanisms of H+ injury in rabbit esophageal epithelium. Am J Physiol. 1984;246 (6 Part 1):G718–24. doi: 10.1152/ajpgi.1984.246.6.G718. [DOI] [PubMed] [Google Scholar]
- 7.Orlando RC, Powell DW, Bryson JC, et al. Esophageal potential difference measurements in esophageal disease. Gastroenterology. 1982;83:1026–32. [PubMed] [Google Scholar]
- 8.Orlando RC, Powell D. Studies of esophageal epithelial electrolyte transport and potential difference in man. In: Allen A, Flemstrom G, Garner A, Silen W, editors. Mechanisms of Mucosal Protection in the Upper Gastrointestinal Tract. Raven Press; New York: 1984. pp. 75–9. [Google Scholar]
- 9.Bove M, Vieth M, Dombrowski F, et al. Acid challenge to the human esophageal mucosa: effects on epithelial architecture in health and disease. Dig Dis Sci. 2005;50:1488–96. doi: 10.1007/s10620-005-2867-3. [DOI] [PubMed] [Google Scholar]
- 10.Farre R, van Malenstein H, De Vos R, et al. Short exposure of oesophageal mucosa to bile acids, both in acidic and weakly acidic conditions, can impair mucosal integrity and provoke dilated intercellular spaces. Gut. 2008;57:1366–74. doi: 10.1136/gut.2007.141804. [DOI] [PubMed] [Google Scholar]
- 11.Tobey NA, Carson JL, Alkiek RA, et al. Dilated intercellular spaces: a morphological feature of acid reflux--damaged human esophageal epithelium. Gastroenterology. 1996;111:1200–5. doi: 10.1053/gast.1996.v111.pm8898633. [DOI] [PubMed] [Google Scholar]
- 12.Solcia E, Villani L, Luinetti O, et al. Altered intercellular glycoconjugates and dilated intercellular spaces of esophageal epithelium in reflux disease. Virchows Arch. 2000;436:207–16. doi: 10.1007/s004280050032. [DOI] [PubMed] [Google Scholar]
- 13.Calabrese C, Fabbri A, Bortolotti M, et al. Dilated intercellular spaces as a marker of oesophageal damage: comparative results in gastro-oesophageal reflux disease with or without bile reflux. Aliment Pharmacol Ther. 2003;18:525–32. doi: 10.1046/j.1365-2036.2003.01713.x. [DOI] [PubMed] [Google Scholar]
- 14.Villanacci V, Grigolato PG, Cestari R, et al. Dilated intercellular spaces as markers of reflux disease: histology, semiquantitative score and morphometry upon light microscopy. Digestion. 2001;64:1–8. doi: 10.1159/000048833. [DOI] [PubMed] [Google Scholar]
- 15.Ravelli AM, Villanacci V, Ruzzenenti N, et al. Dilated intercellular spaces: a major morphological feature of esophagitis. J Pediatr Gastroenterol Nutr. 2006;42:510–5. doi: 10.1097/01.mpg.0000215312.78664.b9. [DOI] [PubMed] [Google Scholar]
- 16.Xue Y, Zhou LY, Lin SR. Dilated intercellular spaces in gastroesophageal reflux disease patients and the changes of intercellular spaces after omeprazole treatment. Chin Med J (Engl) 2008;121:1297–301. [PubMed] [Google Scholar]
- 17.Calabrese C, Bortolotti M, Fabbri A, et al. Reversibility of GERD ultrastructural alterations and relief of symptoms after omeprazole treatment. Am J Gastroenterol. 2005;100:537–42. doi: 10.1111/j.1572-0241.2005.40476.x. [DOI] [PubMed] [Google Scholar]
- 18.Hartsock A, Nelson WJ. Adherens and tight junctions: structure, function and connections to the actin cytoskeleton. Biochim Biophys Acta. 2008;1778:660–9. doi: 10.1016/j.bbamem.2007.07.012. [DOI] [PMC free article] [PubMed] [Google Scholar]
- 19.Tobey NA, Argote CM, Hosseini SS, et al. Calcium-switch technique and junctional permeability in native rabbit esophageal epithelium. Am J Physiol Gastrointest Liver Physiol. 2004;286:G1042–9. doi: 10.1152/ajpgi.00387.2003. [DOI] [PubMed] [Google Scholar]
- 20.Dobson H, Pignatelli M, Hopwood D, et al. Cell adhesion molecules in oesophageal epithelium. Gut. 1994;35:1343–7. doi: 10.1136/gut.35.10.1343. [DOI] [PMC free article] [PubMed] [Google Scholar]
- 21.Tobey NA, Djukic Z, Brighton LE, et al. Lateral cell membranes and shunt resistance in rabbit esophageal epithelium. Dig Dis Sci. 2010;55:1856–65. doi: 10.1007/s10620-010-1215-4. [DOI] [PubMed] [Google Scholar]
- 22.Tobey NA, Argote CM, Vanegas XC, et al. Electrical parameters and ion species for active transport in human esophageal stratified squamous epithelium and Barrett’s specialized columnar epithelium. Am J Physiol Gastrointest Liver Physiol. 2007;293:G264–70. doi: 10.1152/ajpgi.00047.2007. [DOI] [PubMed] [Google Scholar]
- 23.Jovov B, Van Itallie CM, Shaheen NJ, et al. Claudin-18: a dominant tight junction protein in Barrett’s esophagus and likely contributor to its acid resistance. Am J Physiol Gastrointest Liver Physiol. 2007;293:G1106–13. doi: 10.1152/ajpgi.00158.2007. [DOI] [PubMed] [Google Scholar]
- 24.Boussadia O, Kutsch S, Hierholzer A, et al. E-cadherin is a survival factor for the lactating mouse mammary gland. Mech Dev. 2002;115:53–62. doi: 10.1016/s0925-4773(02)00090-4. [DOI] [PubMed] [Google Scholar]
- 25.Rock JR, Onaitis MW, Rawlins EL, et al. Basal cells as stem cells of the mouse trachea and human airway epithelium. Proc Natl Acad Sci USA. 2009;106:12771–5. doi: 10.1073/pnas.0906850106. [DOI] [PMC free article] [PubMed] [Google Scholar]
- 26.Que J, Wilm B, Hasegawa H, et al. Mesothelium contributes to vascular smooth muscle and mesenchyme during lung development. Proc Natl Acad Sci USA. 2008;105:16626–30. doi: 10.1073/pnas.0808649105. [DOI] [PMC free article] [PubMed] [Google Scholar]
- 27.Que J, Luo X, Schwartz RJ, et al. Multiple roles for Sox2 in the developing and adult mouse trachea. Development. 2009;136:1899–907. doi: 10.1242/dev.034629. [DOI] [PMC free article] [PubMed] [Google Scholar]
- 28.Holmes JL, Van Itallie CM, Rasmussen JE, et al. Claudin profiling in the mouse during postnatal intestinal development and along the gastrointestinal tract reveals complex expression patterns. Gene Expr Patterns. 2006;6:581–8. doi: 10.1016/j.modgep.2005.12.001. [DOI] [PubMed] [Google Scholar]
- 29.Matsuyoshi N, Tanaka T, Toda K, et al. Soluble E-cadherin: a novel cutaneous disease marker. Br J Dermatol. 1995;132:745–9. doi: 10.1111/j.1365-2133.1995.tb00720.x. [DOI] [PubMed] [Google Scholar]
- 30.Crawford HC, Dempsey PJ, Brown G, et al. ADAM10 as a therapeutic target for cancer and inflammation. Curr Pharm Des. 2009;15:2, 288–99. doi: 10.2174/138161209788682442. [DOI] [PubMed] [Google Scholar]
- 31.De Wever O, Derycke L, Hendrix A, et al. Soluble cadherins as cancer biomarkers. Clin Exp Metastasis. 2007;24:685–97. doi: 10.1007/s10585-007-9104-8. [DOI] [PubMed] [Google Scholar]
- 32.Chan AO, Lam SK, Chu KM, et al. Soluble E-cadherin is a valid prognostic marker in gastric carcinoma. Gut. 2001;48:808–11. doi: 10.1136/gut.48.6.808. [DOI] [PMC free article] [PubMed] [Google Scholar]
- 33.Derycke L, De Wever O, Stove V, et al. Soluble N-cadherin in human biological fluids. Int J Cancer. 2006;119:2895–900. doi: 10.1002/ijc.22219. [DOI] [PubMed] [Google Scholar]
- 34.Noe V, Fingleton B, Jacobs K, et al. Release of an invasion promoter E-cadherin fragment by matrilysin and stromelysin-1. J Cell Sci. 2001;114 (Part 1):111–8. doi: 10.1242/jcs.114.1.111. [DOI] [PubMed] [Google Scholar]
- 35.Maretzky T, Reiss K, Ludwig A, et al. ADAM10 mediates E-cadherin shedding and regulates epithelial cell-cell adhesion, migration, and beta-catenin translocation. Proc Natl Acad Sci USA. 2005;102:9182–7. doi: 10.1073/pnas.0500918102. [DOI] [PMC free article] [PubMed] [Google Scholar]
- 36.Maretzky T, Scholz F, Koten B, et al. ADAM10-mediated E-cadherin release is regulated by proinflammatory cytokines and modulates keratinocyte cohesion in eczematous dermatitis. J Invest Dermatol. 2008;128:1737–46. doi: 10.1038/sj.jid.5701242. [DOI] [PubMed] [Google Scholar]
- 37.Frank CF, Hostetter MK. Cleavage of E-cadherin: a mechanism for disruption of the intestinal epithelial barrier by Candida albicans. Transl Res. 2007;149:211–22. doi: 10.1016/j.trsl.2006.11.006. [DOI] [PubMed] [Google Scholar]
- 38.Marambaud P, Shioi J, Serban G, et al. A presenilin-1/gamma-secretase cleavage releases the E-cadherin intracellular domain and regulates disassembly of adherens junctions. EMBO J. 2002;21:1948–56. doi: 10.1093/emboj/21.8.1948. [DOI] [PMC free article] [PubMed] [Google Scholar]
- 39.Steinhusen U, Weiske J, Badock V, et al. Cleavage and shedding of E-cadherin after induction of apoptosis. J Biol Chem. 2001;276:4972–80. doi: 10.1074/jbc.M006102200. [DOI] [PubMed] [Google Scholar]
- 40.Niessen CM. Tight junctions/adherens junctions: basic structure and function. J Invest Dermatol. 2007;127:2525–32. doi: 10.1038/sj.jid.5700865. [DOI] [PubMed] [Google Scholar]
- 41.Barlow WJ, Orlando RC. The pathogenesis of heartburn in nonerosive reflux disease: a unifying hypothesis. Gastroenterology. 2005;128:771–8. doi: 10.1053/j.gastro.2004.08.014. [DOI] [PubMed] [Google Scholar]
- 42.Orlando RC. Current understanding of the mechanisms of gastrooesophageal reflux disease. Drugs. 2006;66(Suppl 1):1–5. doi: 10.2165/00003495-200666001-00002. discussion 29–33. [DOI] [PubMed] [Google Scholar]
- 43.Jovov B, Dellon ES, Djukic Z, et al. Cleavage of e-cadherin is more specific than dilated intercellular spaces within esophageal epithelium for the diagnosis of gastroesophageal reflux disease. Gastroenterology. 2010;138 (Suppl 5):S153. [Google Scholar]
- 44.Mueller S, Neureiter D, Aigner T, et al. Comparison of histological parameters for the diagnosis of eosinophilic oesophagitis versus gastrooesophageal reflux disease on oesophageal biopsy material. Histopathology. 2008;53:676–84. doi: 10.1111/j.1365-2559.2008.03187.x. [DOI] [PubMed] [Google Scholar]
- 45.Rodrigo S, Abboud G, Oh D, et al. High intraepithelial eosinophil counts in esophageal squamous epithelium are not specific for eosinophilic esophagitis in adults. Am J Gastroenterol. 2008;103:435–42. doi: 10.1111/j.1572-0241.2007.01594.x. [DOI] [PubMed] [Google Scholar]
- 46.Spechler SJ, Genta RM, Souza RF. Thoughts on the complex relationship between gastroesophageal reflux disease and eosinophilic esophagitis. Am J Gastroenterol. 2007;102:1301–6. doi: 10.1111/j.1572-0241.2007.01179.x. [DOI] [PubMed] [Google Scholar]